Trend Maps and Performance Charts were developed using the I-95 Corridor Coalition’s Vehicle Probe Project Suite. These visualizations allow you to examine the affect of WMATA’s year long SafeTrack Program on specific roadways affected by each Safety Surge. Trend Maps (found in the PDFs) allow you to animate and compare roadway conditions throughout the day. Performance Charts allow you to compare changes in weekday travel time index along specific corridors in each surge. Click to view the chart for the roadway segment you are interested in.
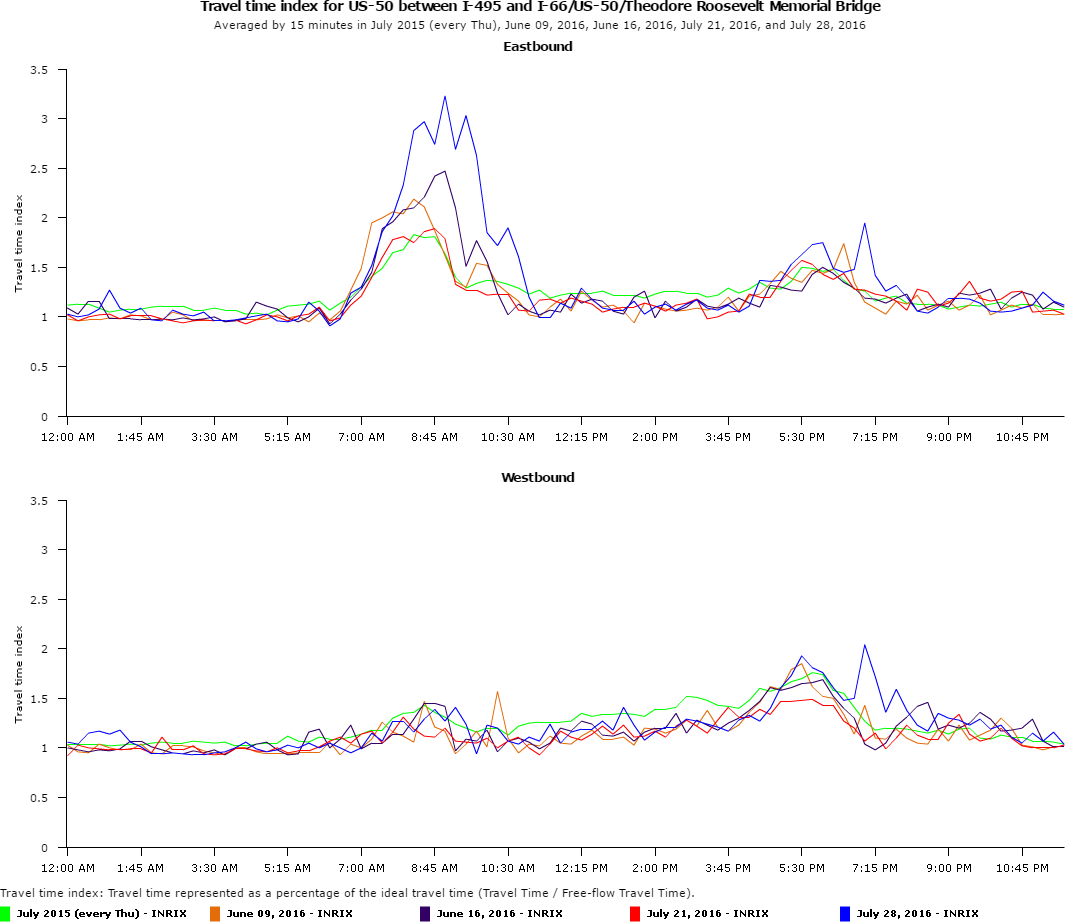
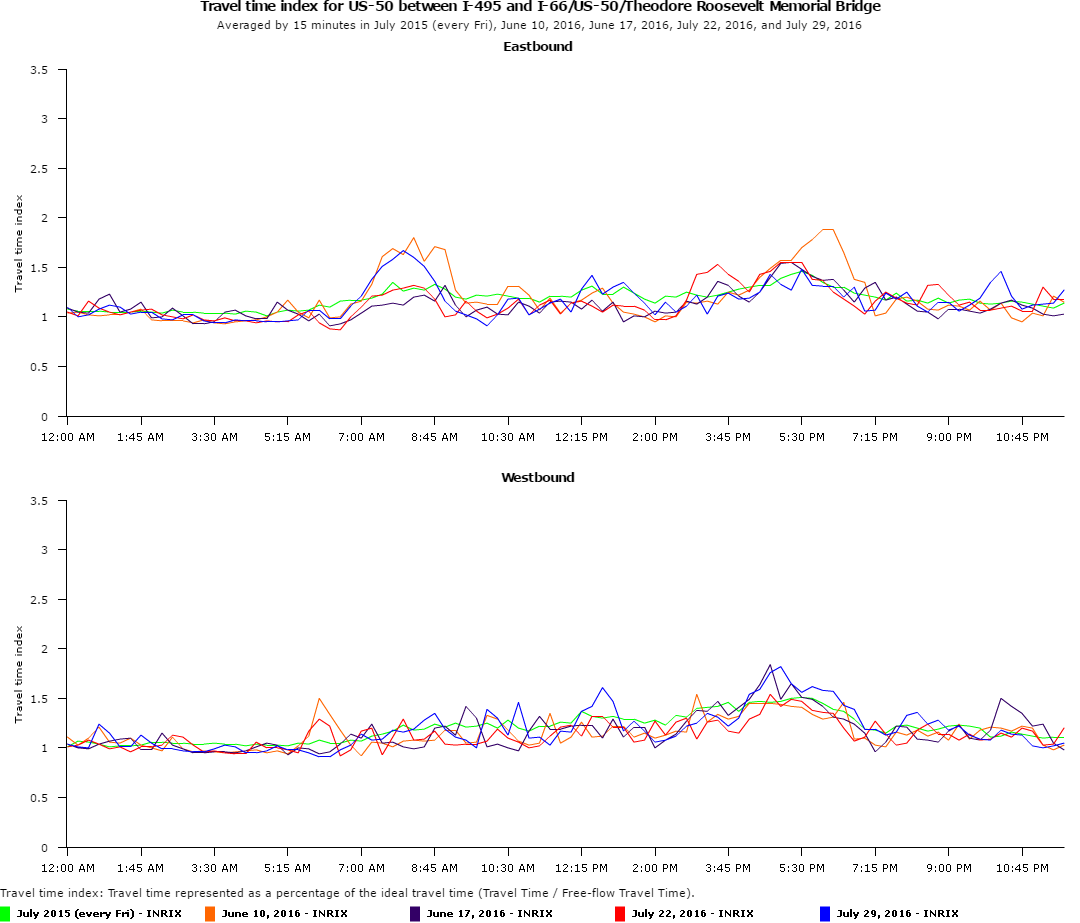
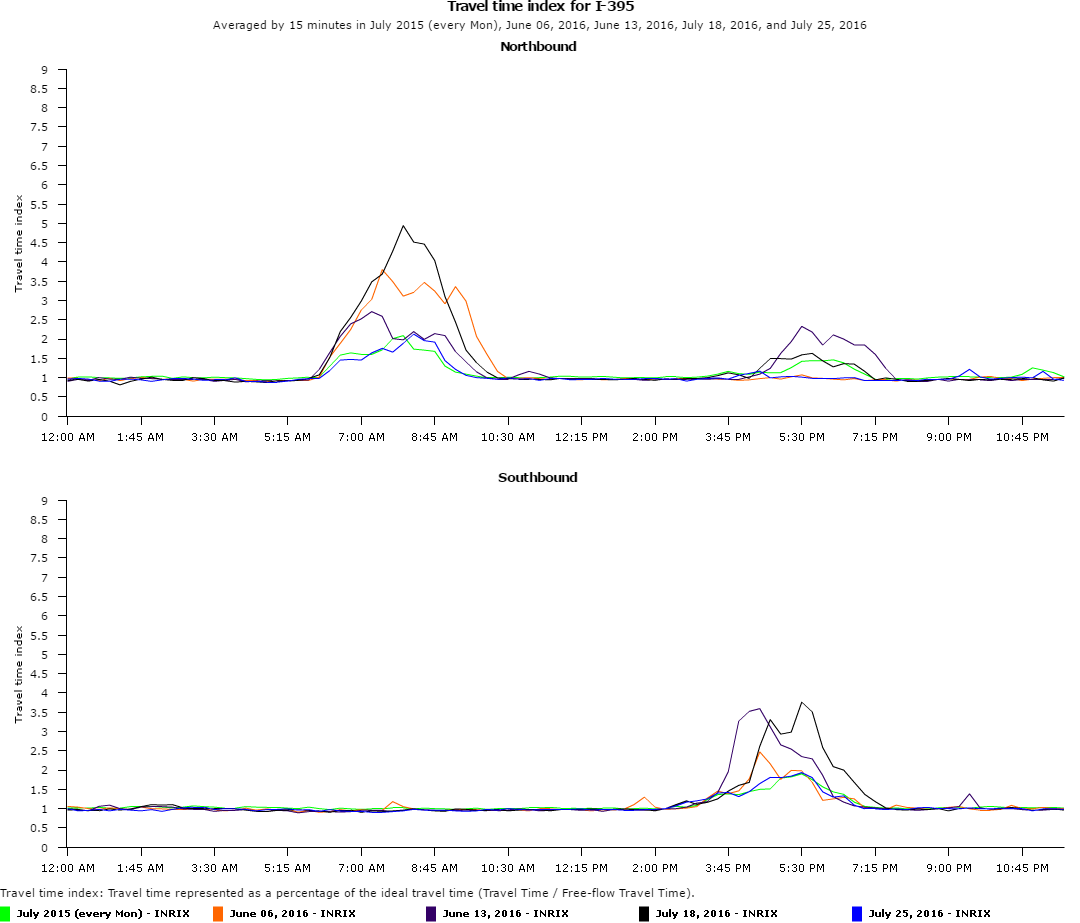
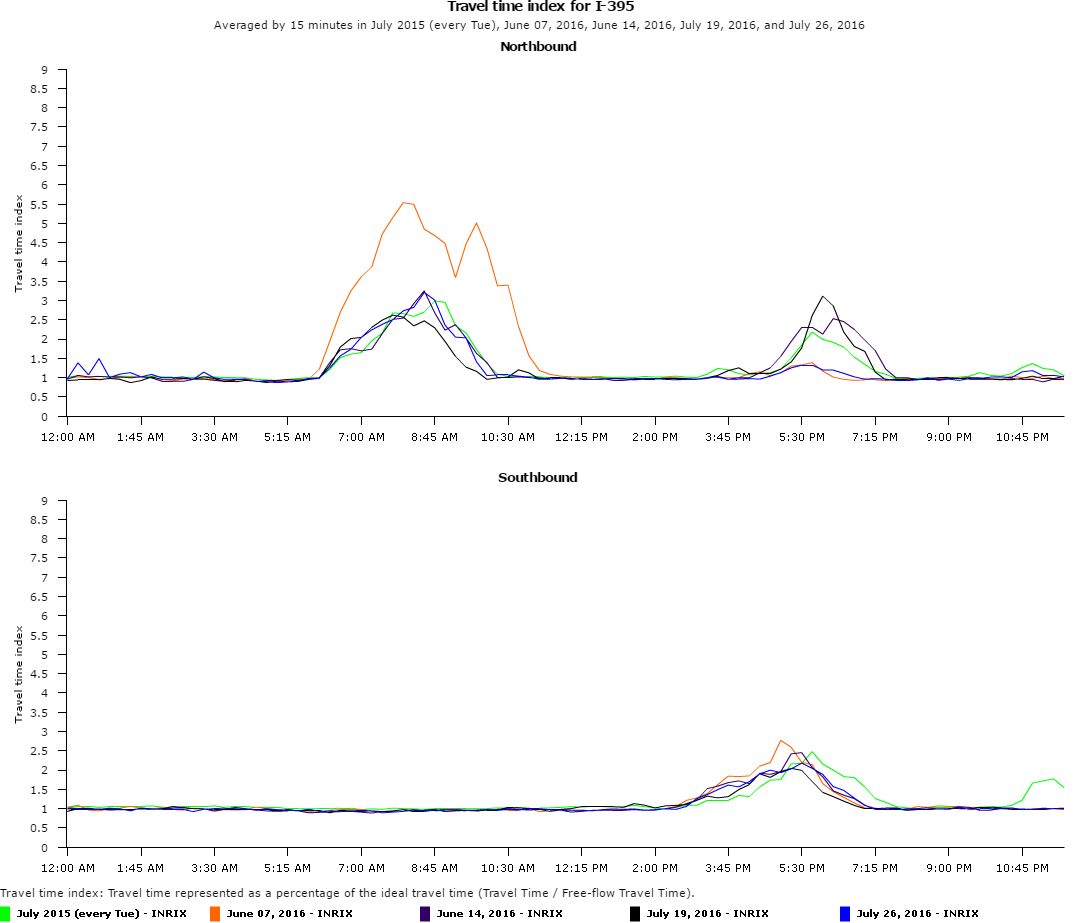
Definition: Travel Time Index (TTI) – The ratio of the travel time during the peak period to the time required to make the same trip at free-flow speeds. A value of 1.5, for example, indicates a 20-minute free-flow trip requires 30 minutes during the peak period. If your normal morning commute in typical traffic measures a TTI of 1.5 and your “SafeTrack” commute now measures 3.0, your commute now takes twice as long (or three times longer when there is no traffic).
WMATA Metrorail SafeTrack: Safety Surge #5 (July 20-31, 2016)
Continuous single tracking of Orange and Silver line trains between East Falls Church and Ballston from July 20 through July 31, 2016.
Download all trend map links & performance charts for Safety Surge #5 (pdf)
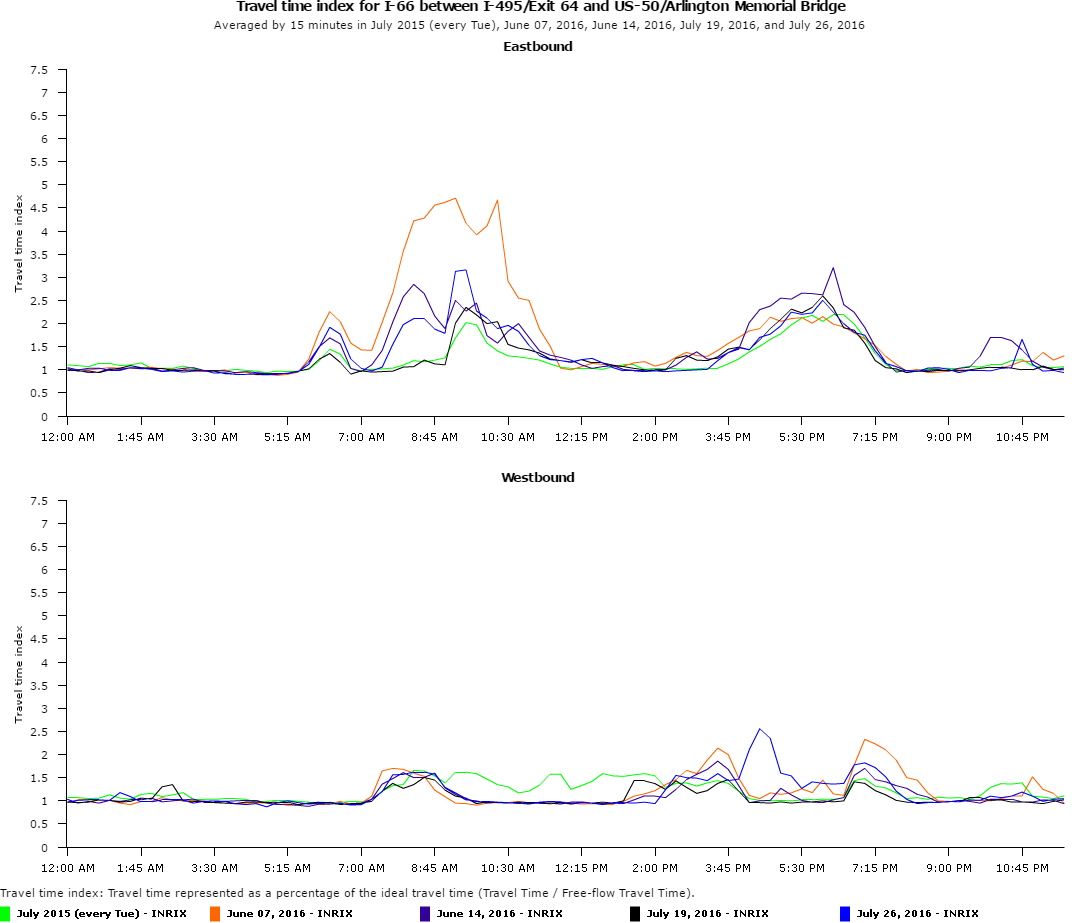
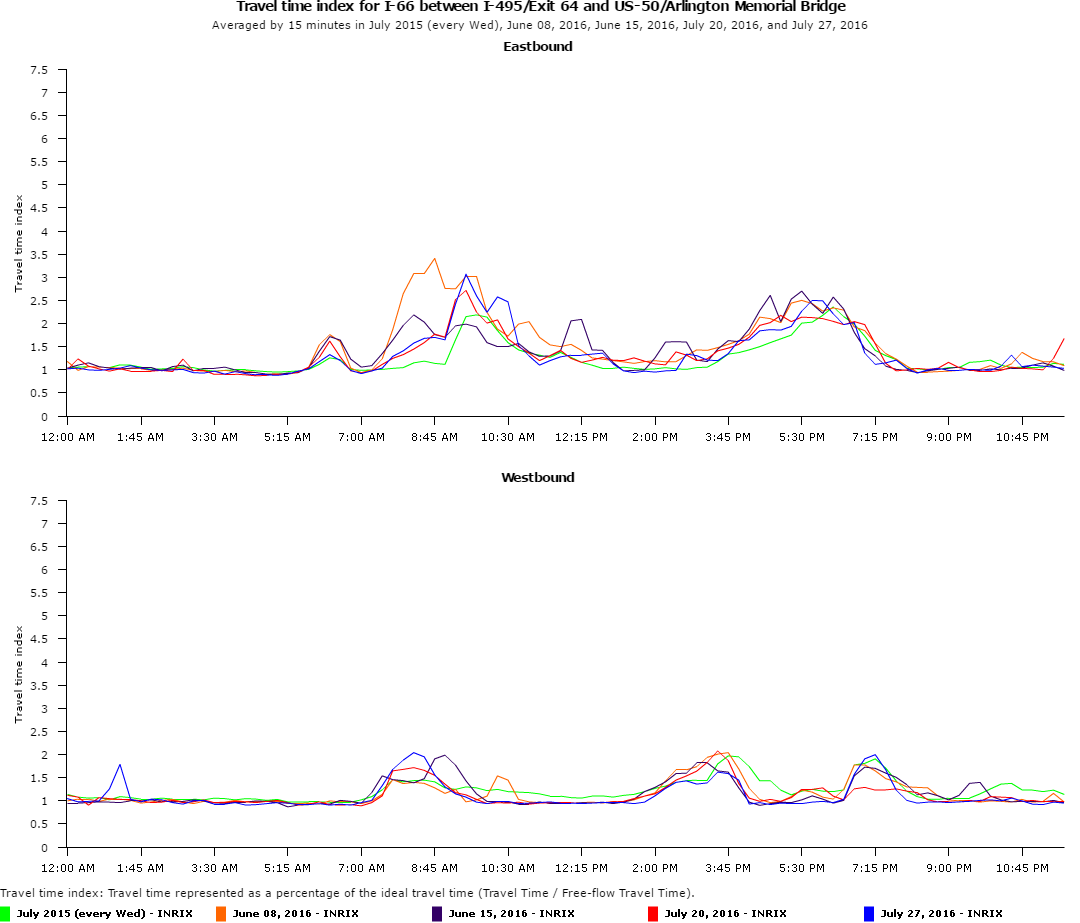
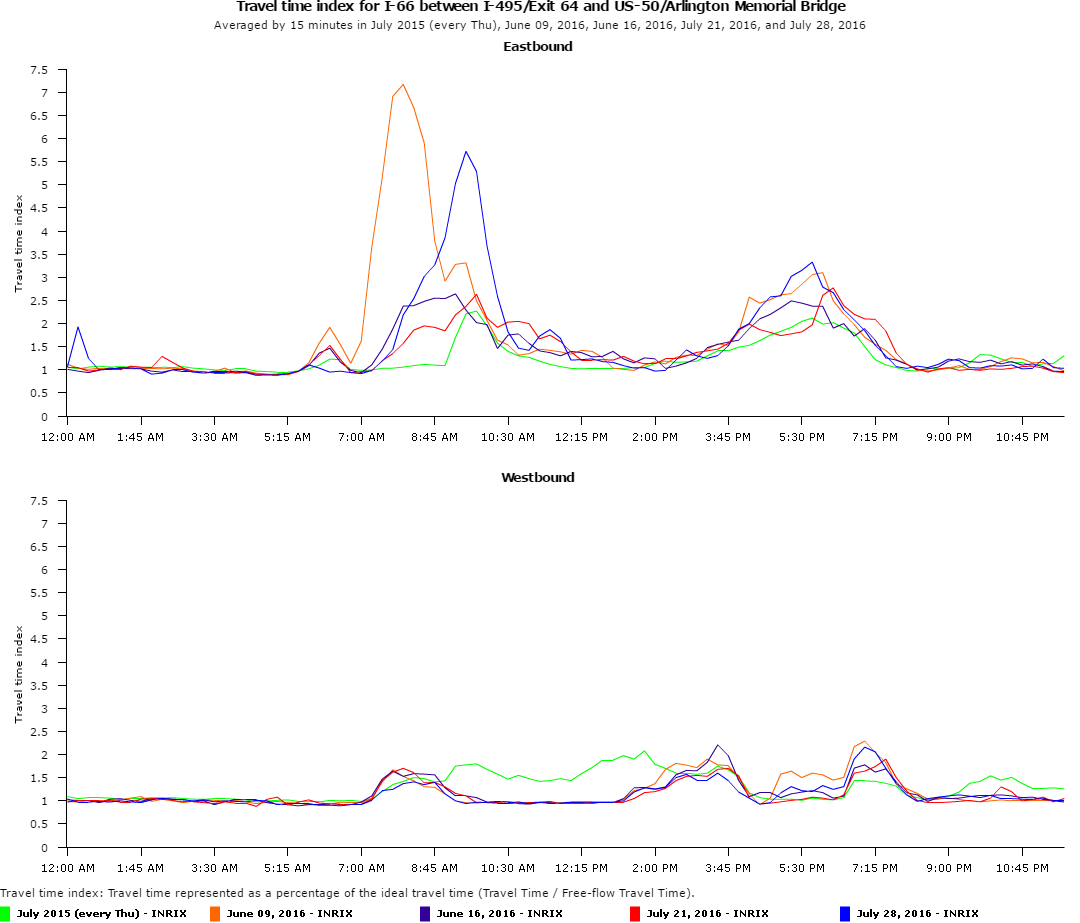
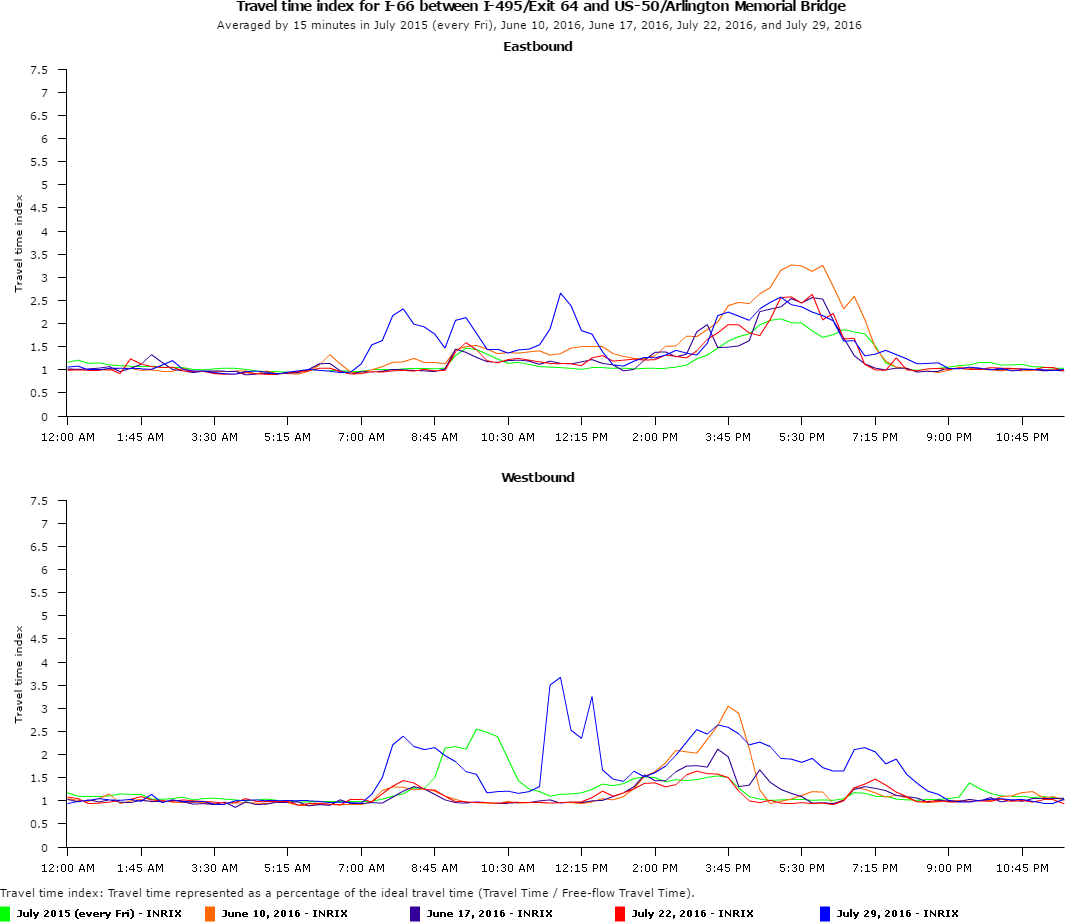
- Travel Time Index Comparison: I-66 between the Capital Beltway and the DC Line; Week 1 (Red) vs Week 2 (Blue) vs Week 1 of Surge 1 (Orange) vs Week 2 of Surge 1 (Purple) vs Average Week July 2015 (Green)
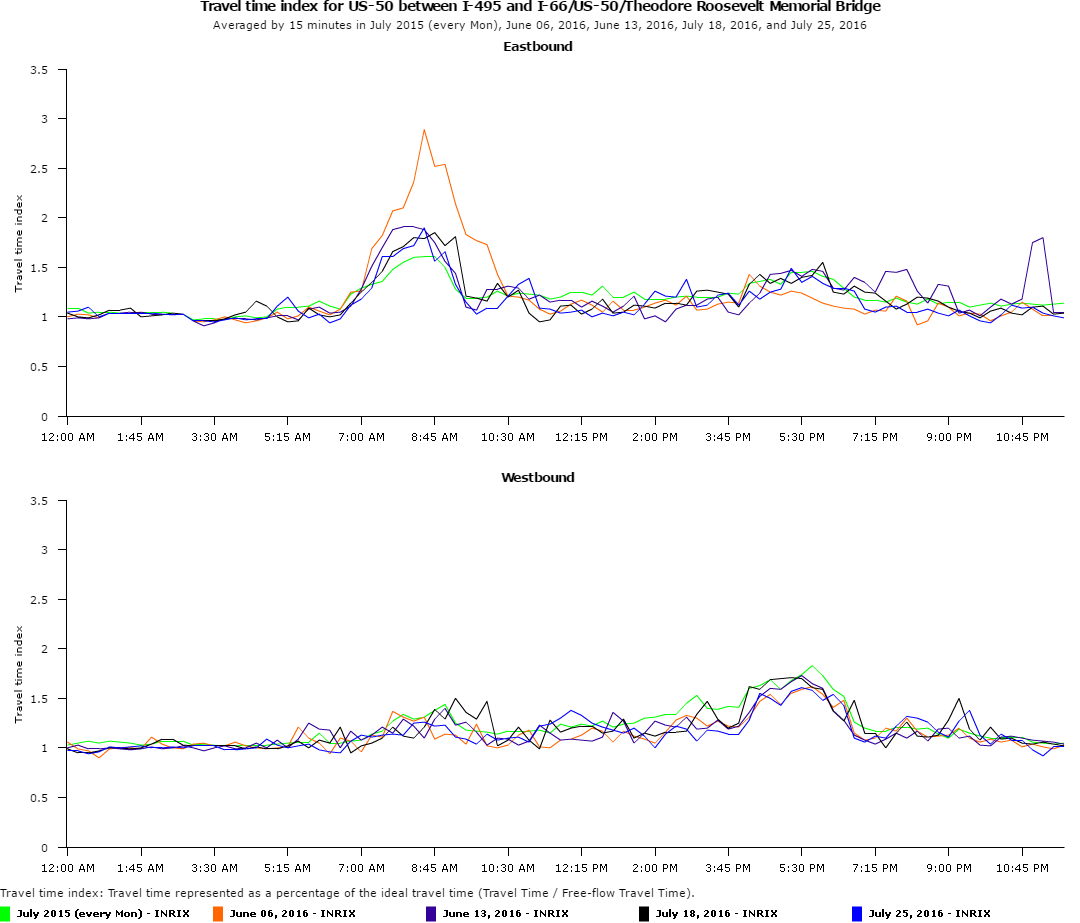
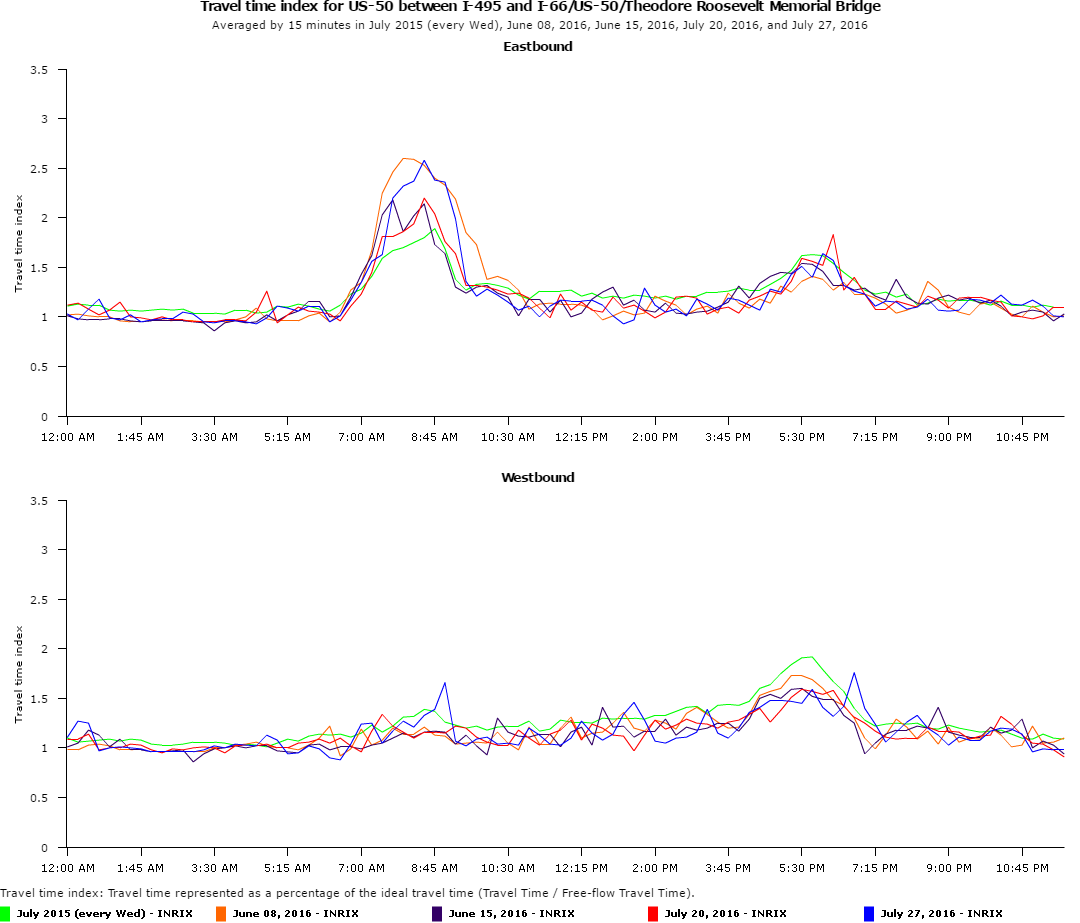
- Travel Time Index Comparison: US-50 between the Capital Beltway and the DC Line; Week 1 (Red) vs Week 2 (Blue) vs Week 1 of Surge 1 (Orange) vs Week 2 of Surge 1 (Purple) vs Average Week July 2015 (Green)
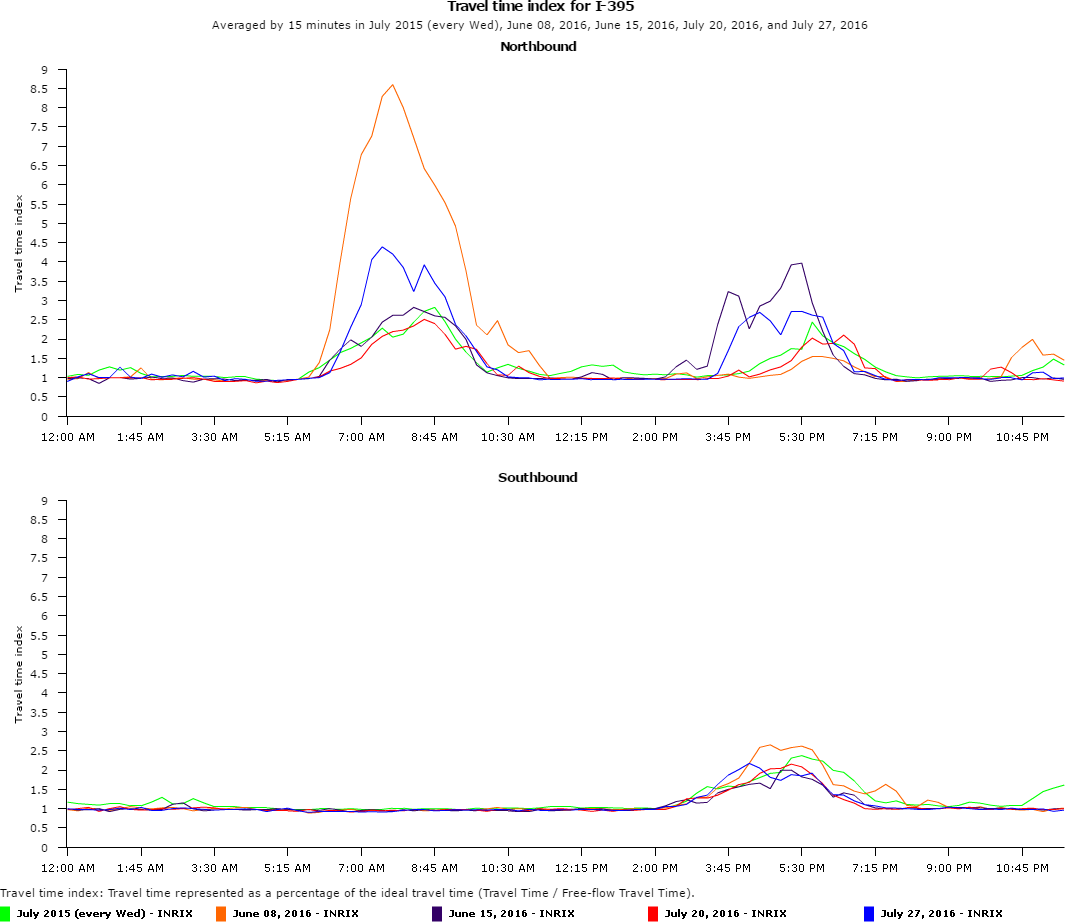
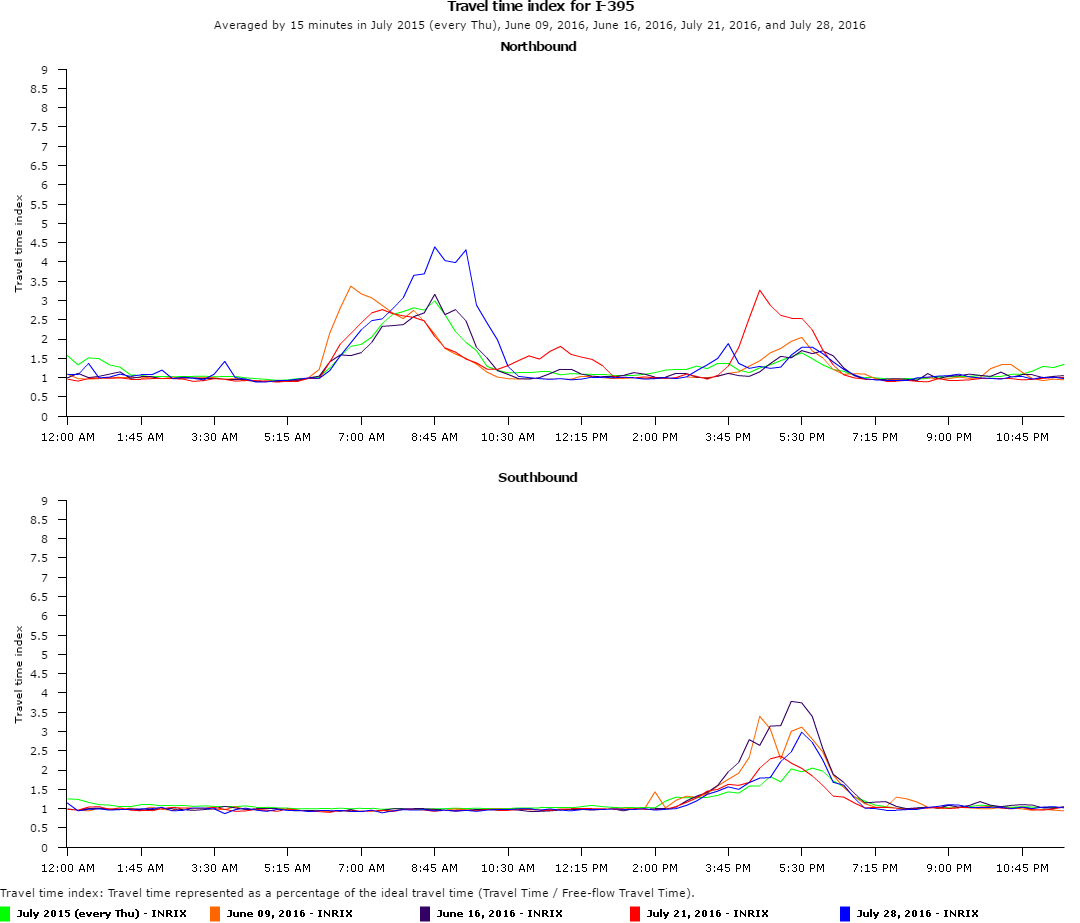
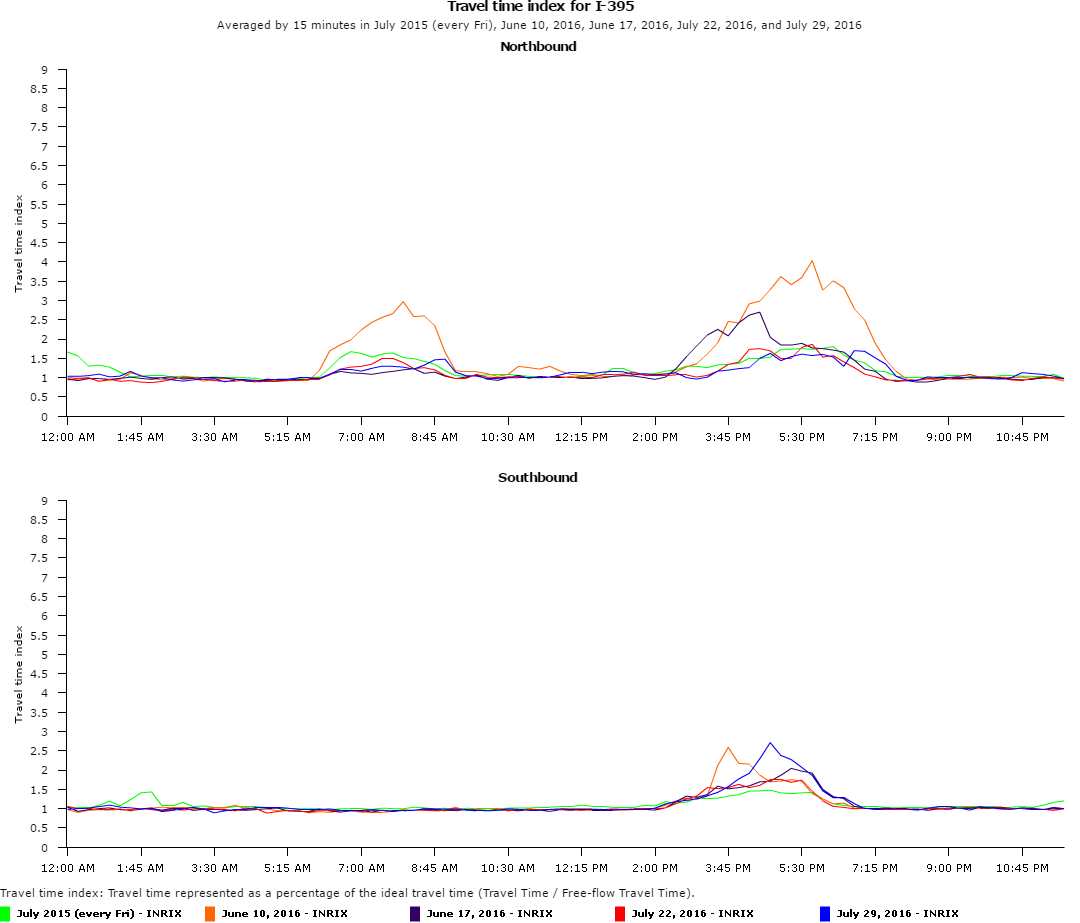
- Travel Time Index Comparison: I-395 between the Capital Beltway and the DC Line; Week 1 Week 1 (Red) vs Week 2 (Blue) vs Week 1 of Surge 1 (Orange) vs Week 2 of Surge 1 (Purple) vs Average Week July 2015 (Green)
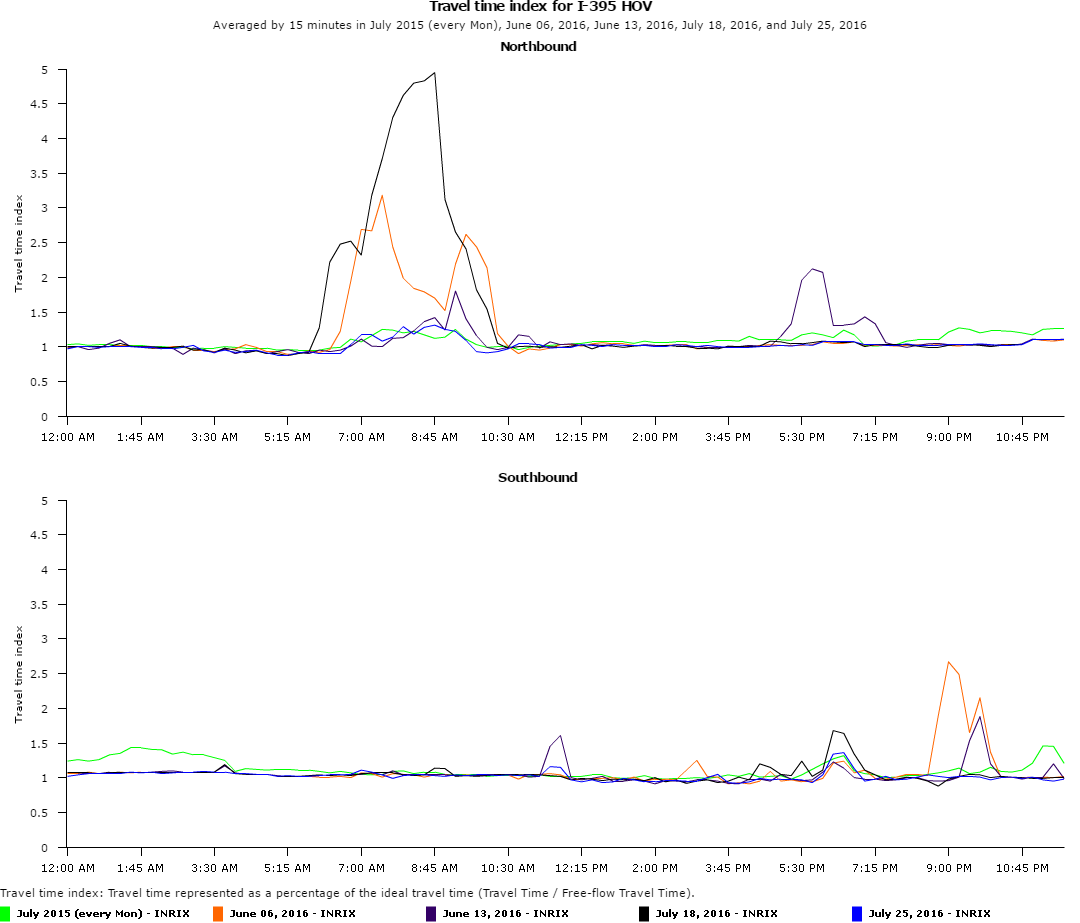
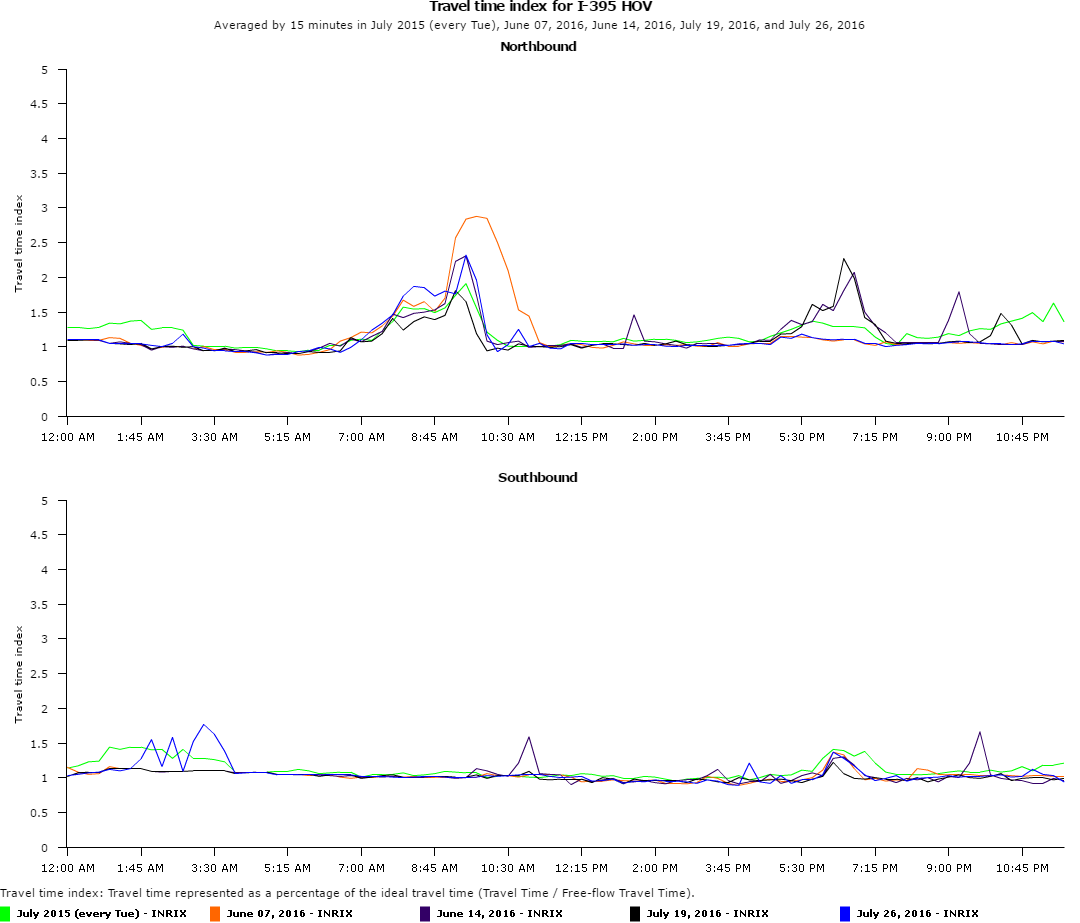
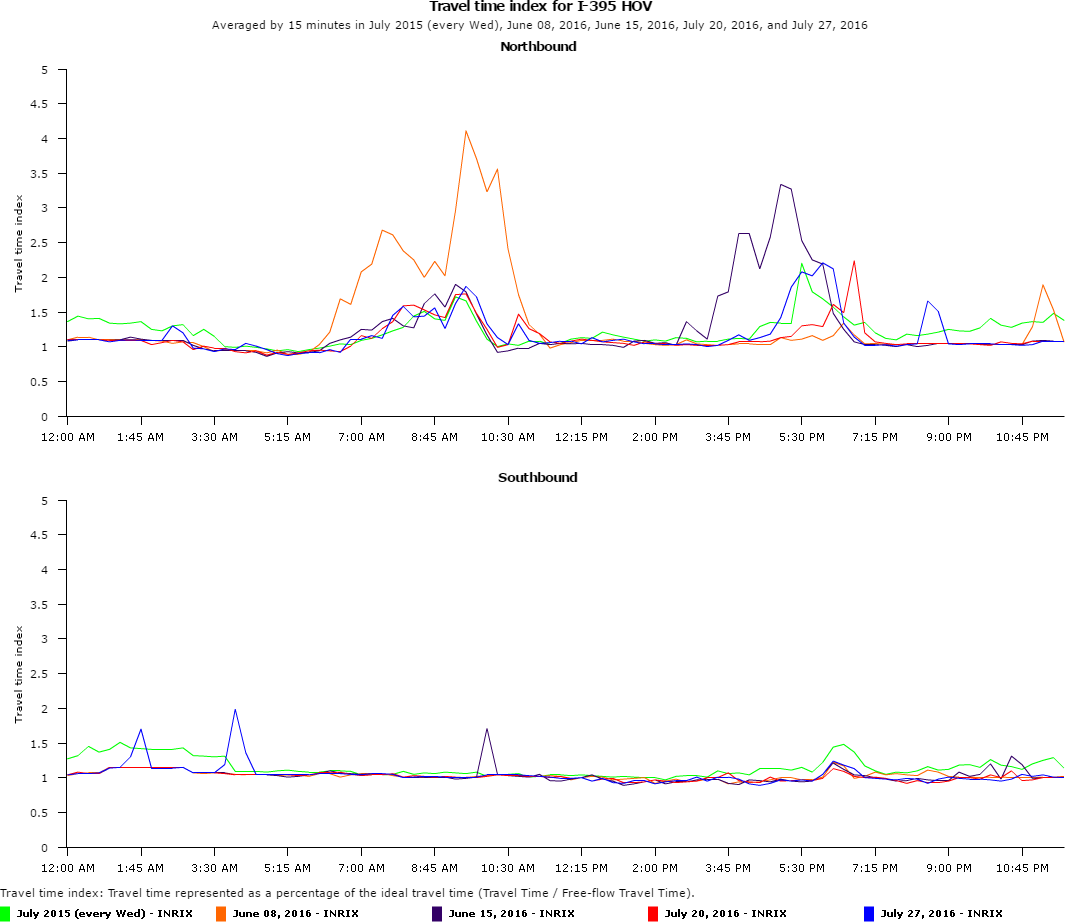
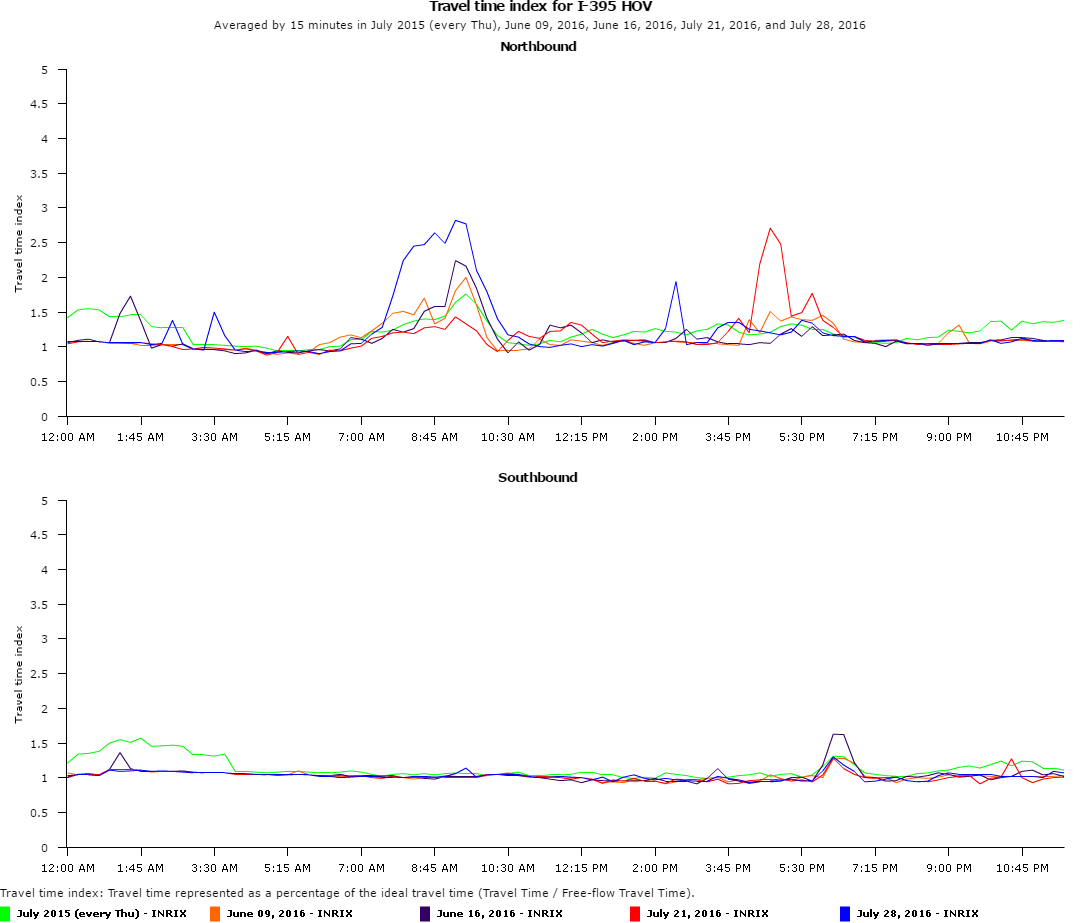
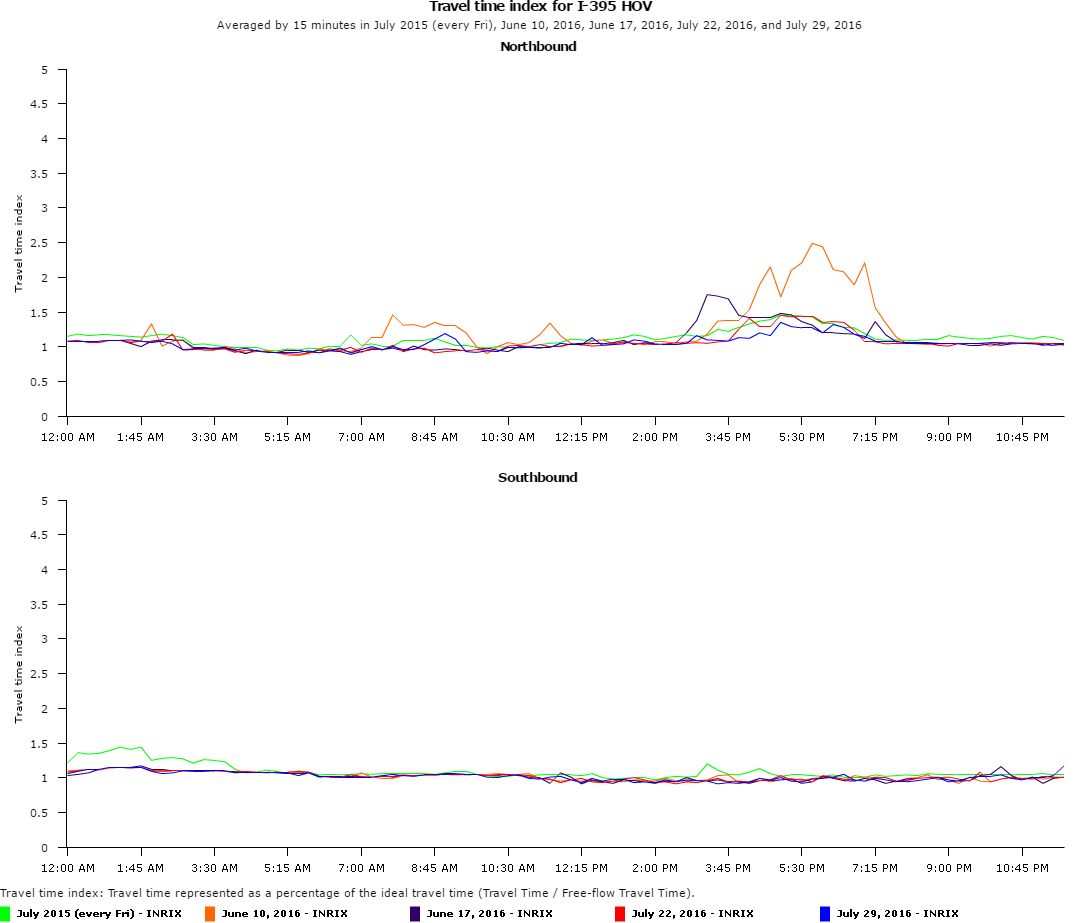
- Travel Time Index Comparison: I-395 HOV between the Capital Beltway and the DC Line; Week 1 (Red) vs Week 2 (Blue) vs Week 1 of Surge 1 (Orange) vs Week 2 of Surge 1 (Purple) vs Average Week July 2015 (Green)
WMATA Metrorail SafeTrack: Safety Surge #3 & #4 (July 5-18, 2016)
Safety Surge #3 (Week 1): Line segment shutdown of Yellow and Blue line trains between National Airport Station and Braddock Road Station from 8PM July 5 through closing July 11, 2016.
Safety Surge #4 (Week 2): Line segment shutdown of Yellow and Blue line trains between National Airport Station from July 12 through July 18, 2016
Download all trend map links & performance charts for Safety Surge #3 & #4 (pdf)
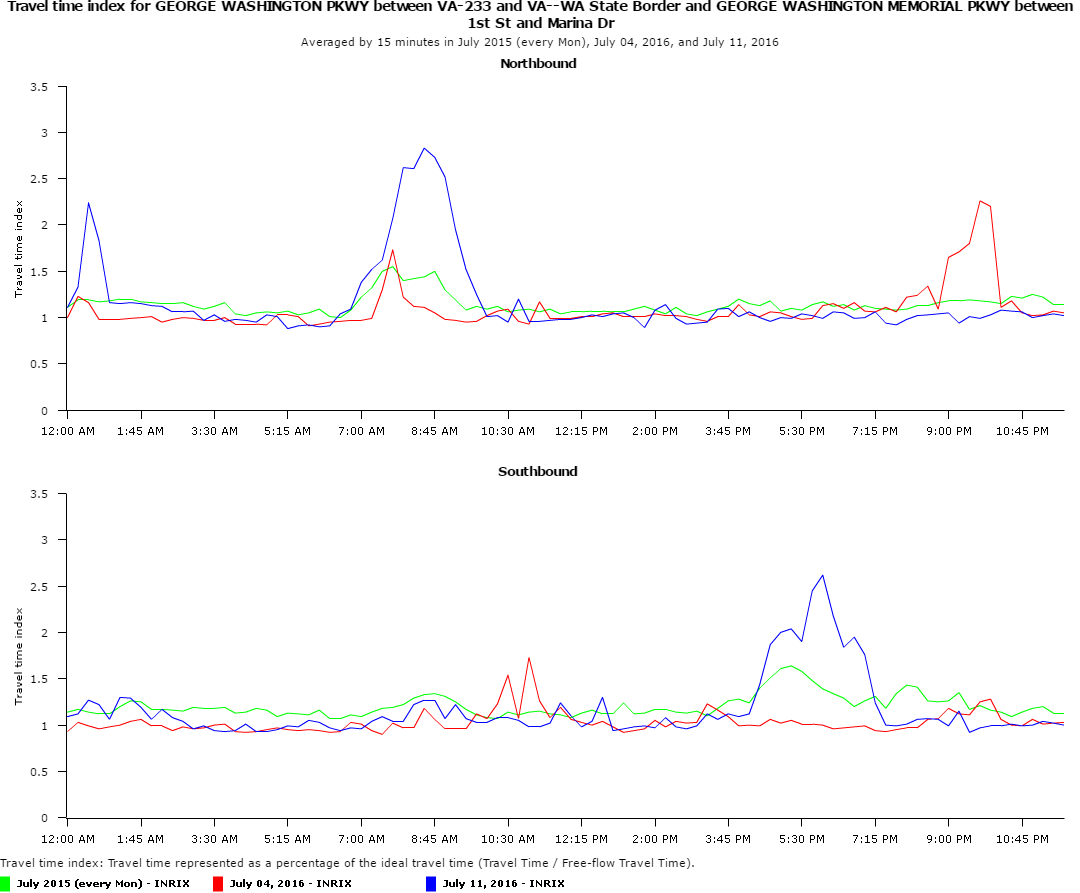
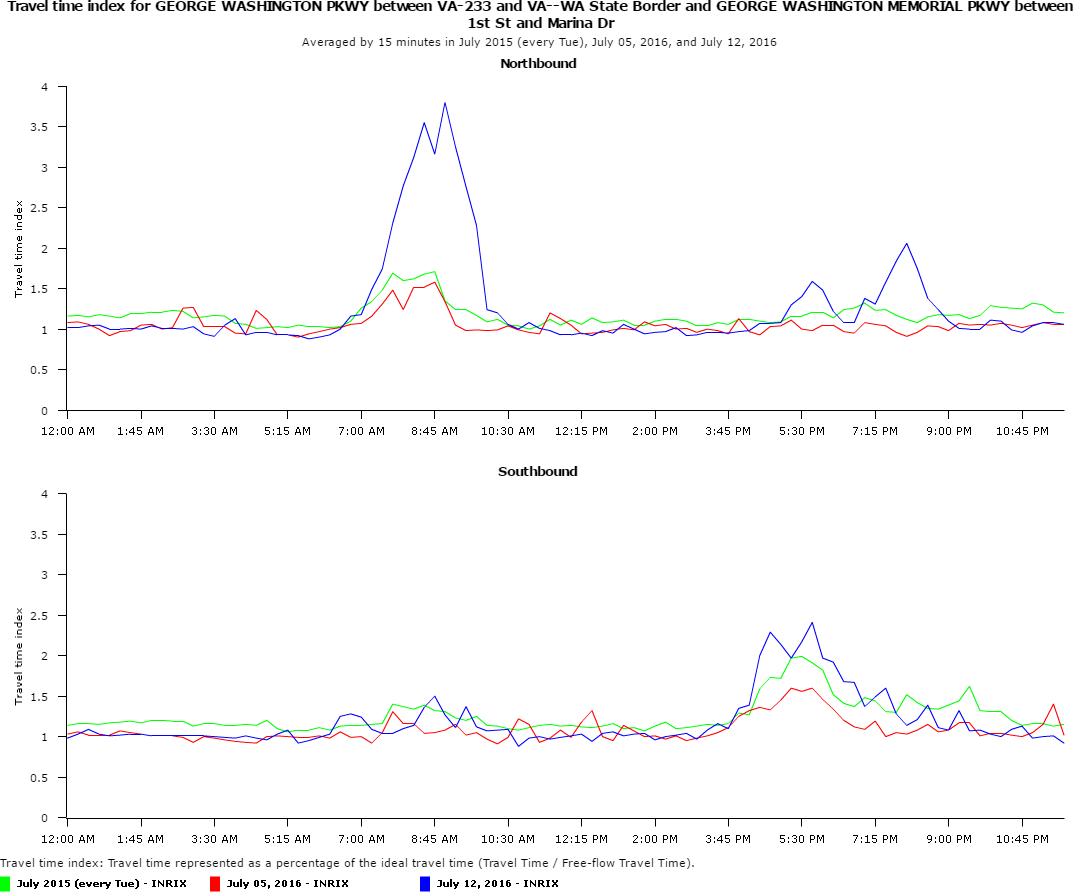
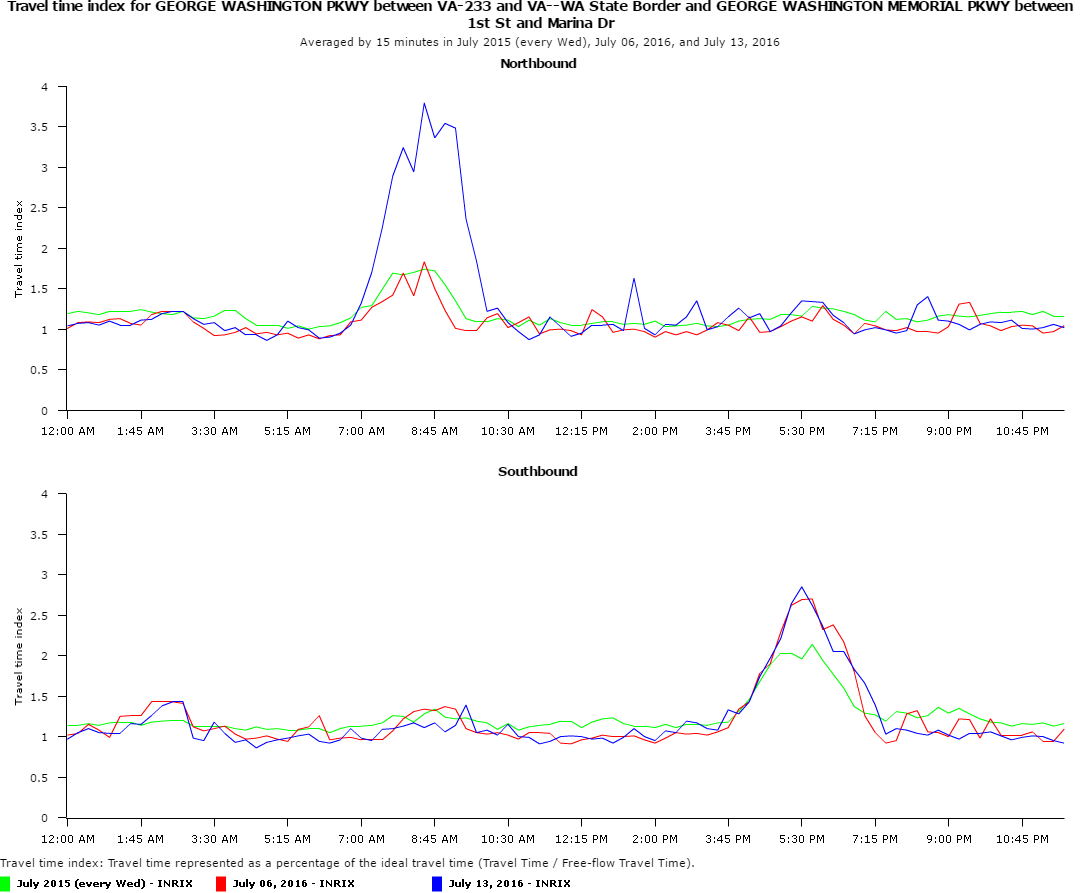
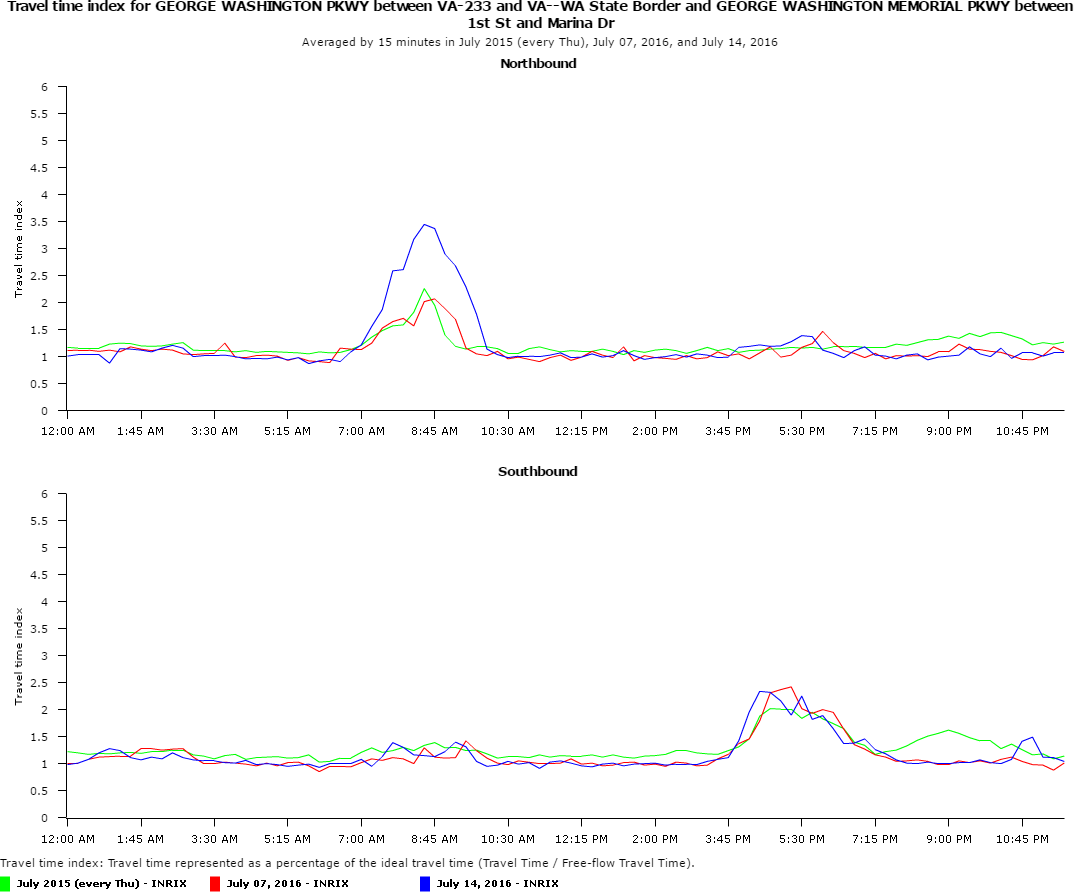
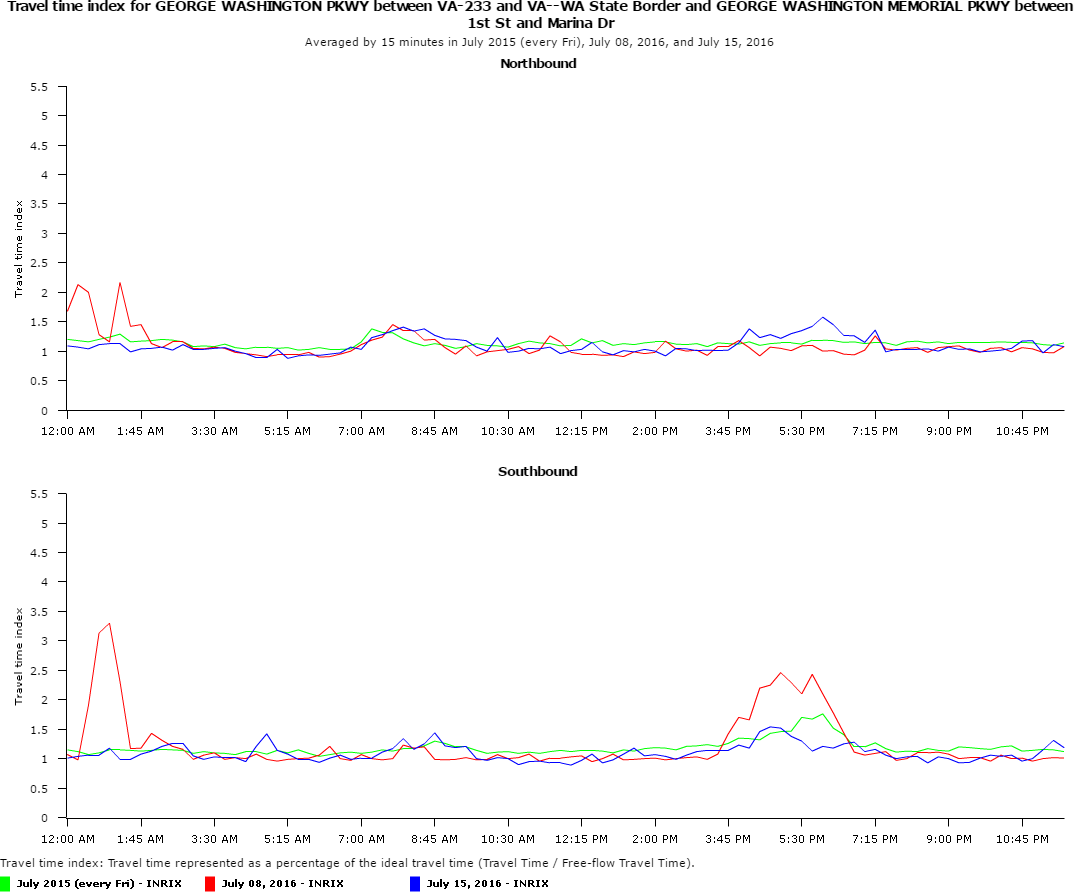
- Travel Time Index Comparison: George Washington Memorial Parkway between 1st Street (Alexandria) and I-395; Surge 3 (Red) vs Surge 4 (Blue) vs Average Week July 2015 (Green)
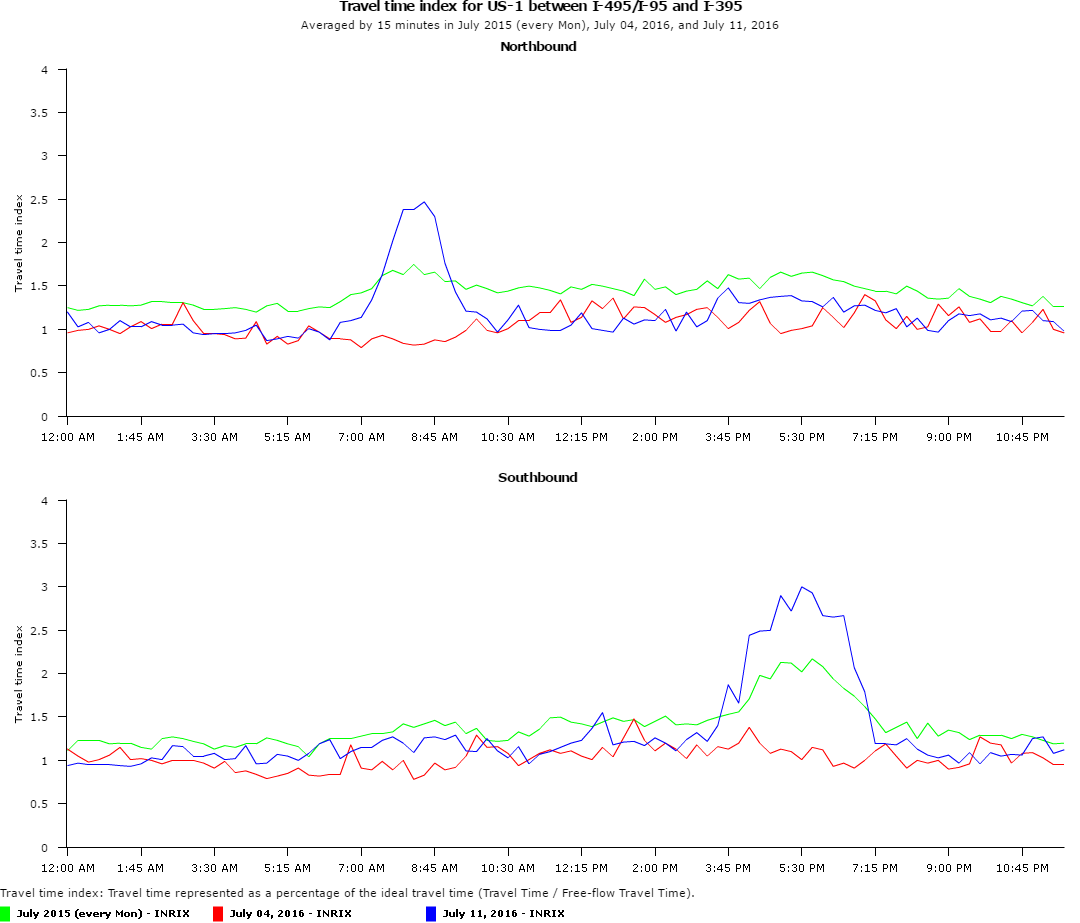
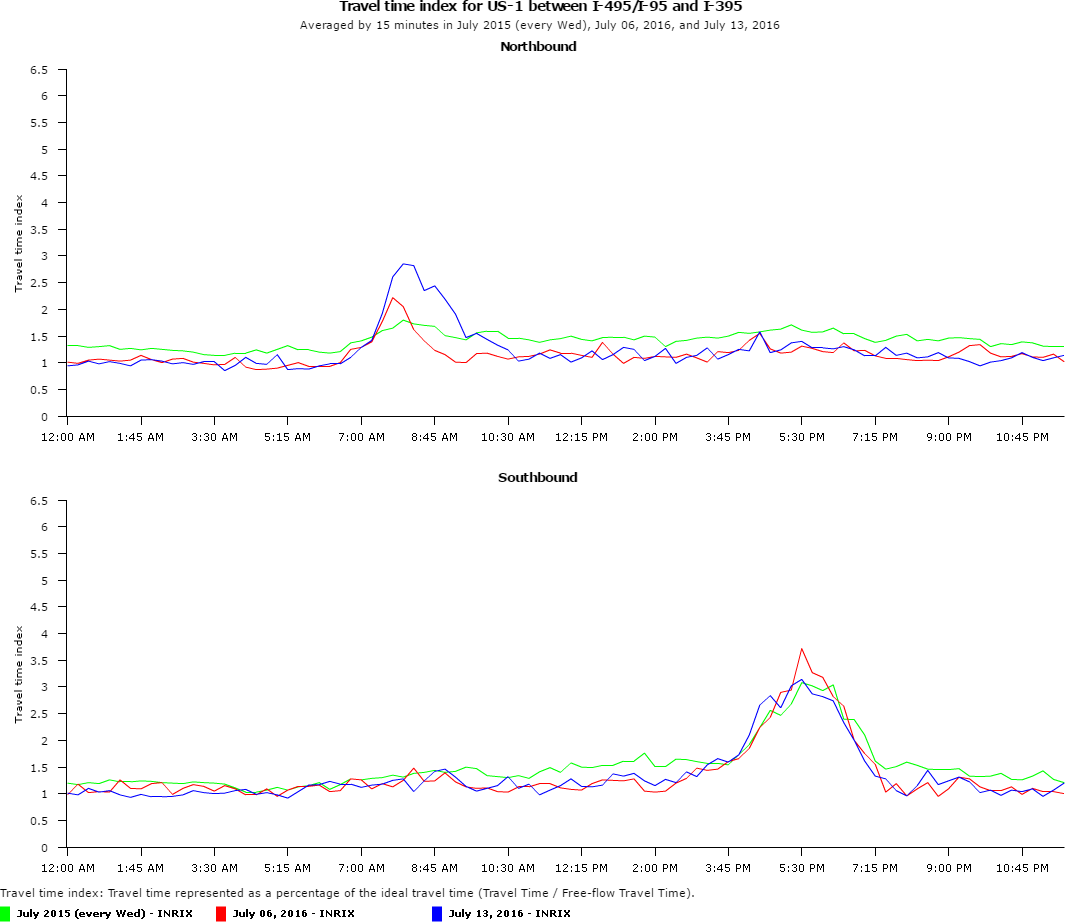
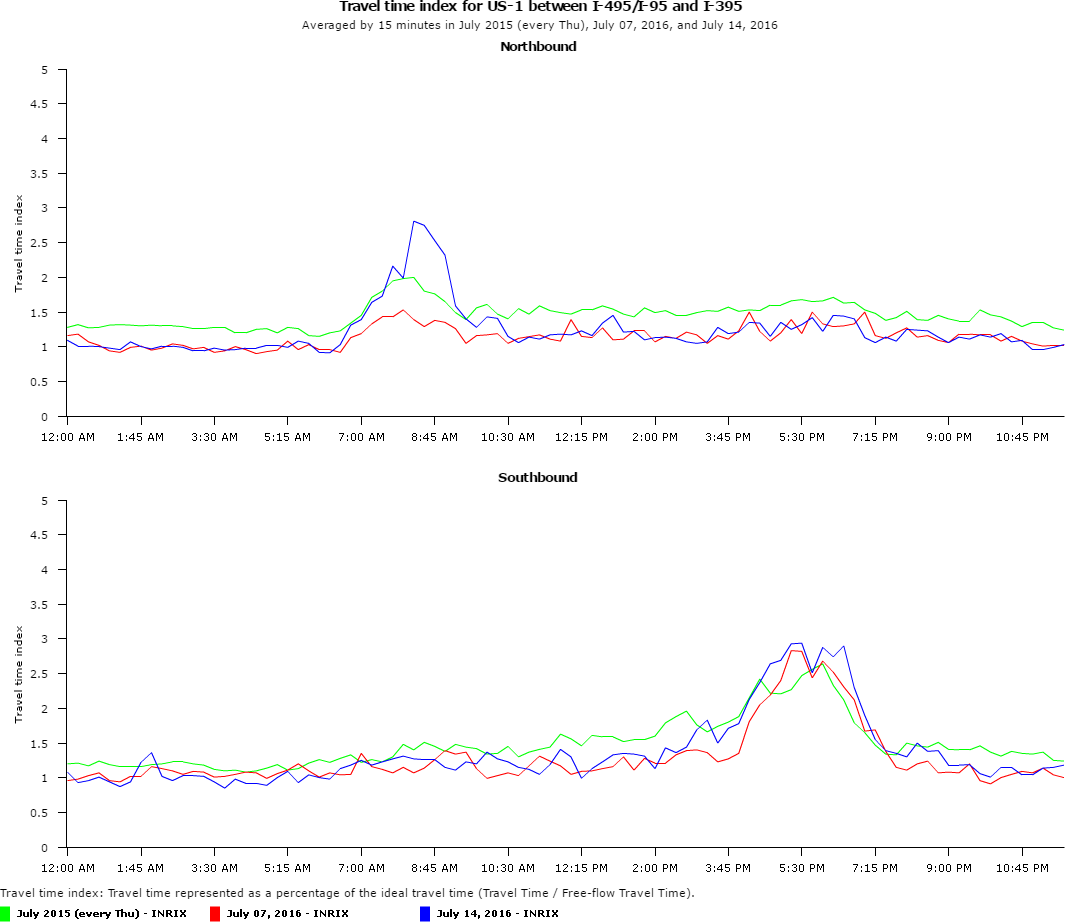
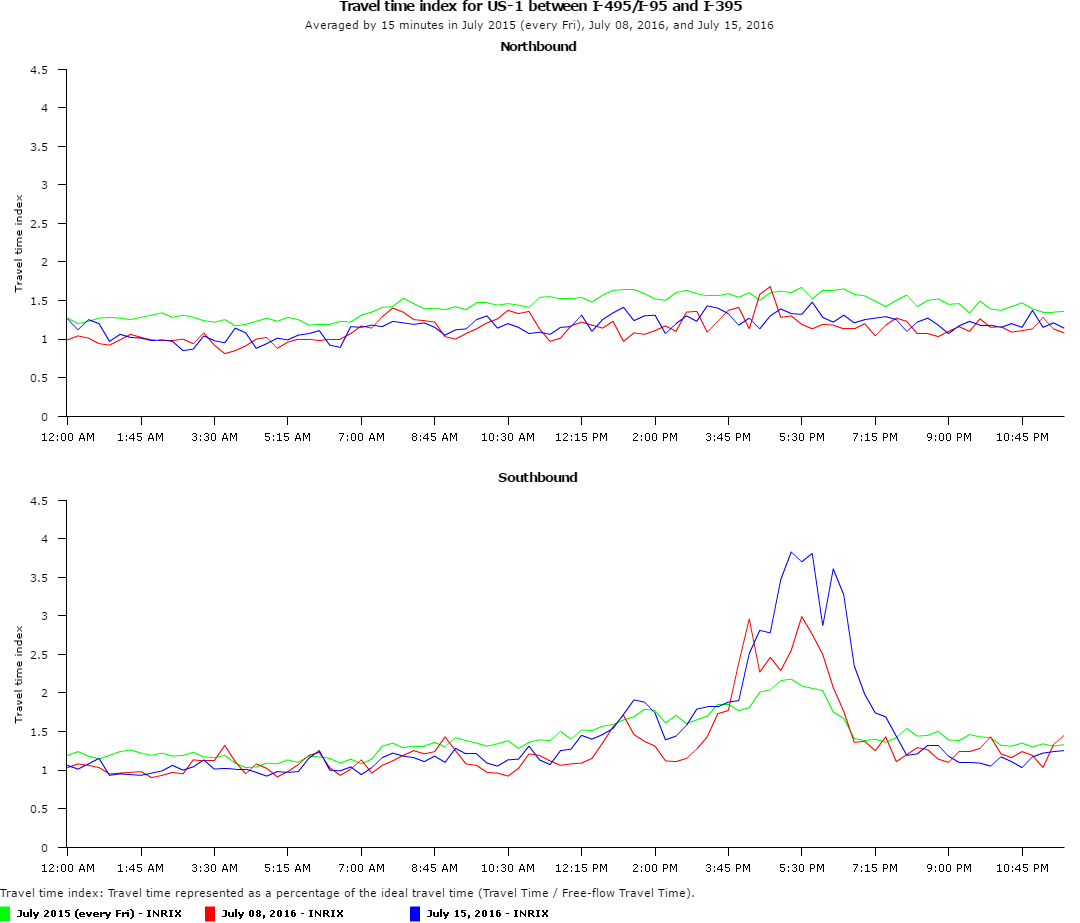
- Travel Time Index Comparison: US-1 between the Capital Beltway and I-395; Surge 3 (Red) vs Surge 4 (Blue) vs Average Week July 2015 (Green)

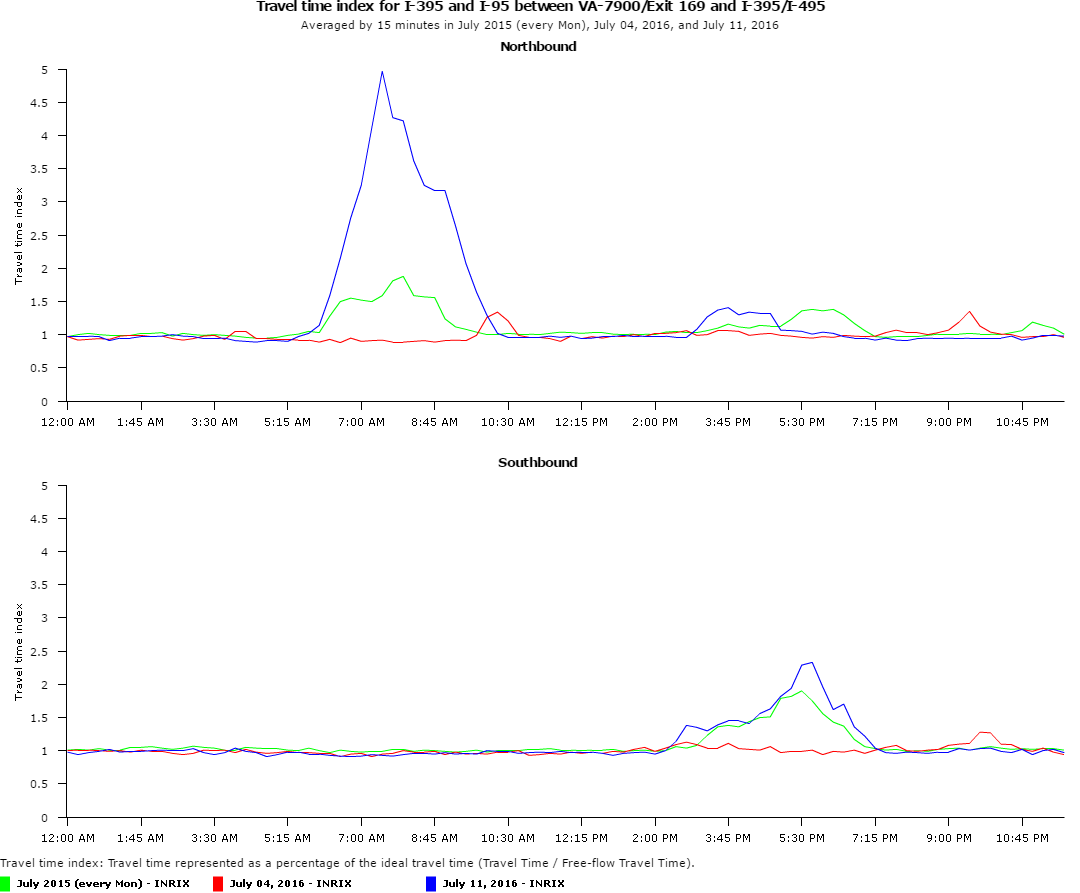
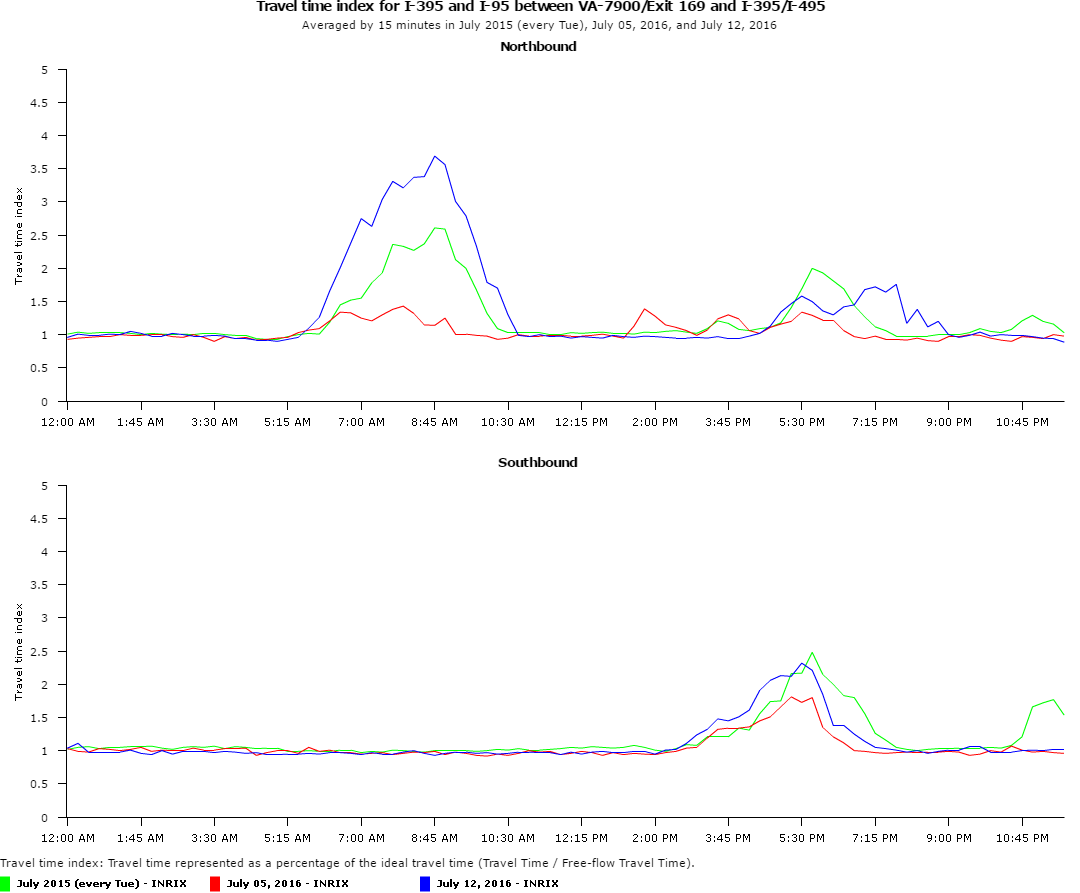
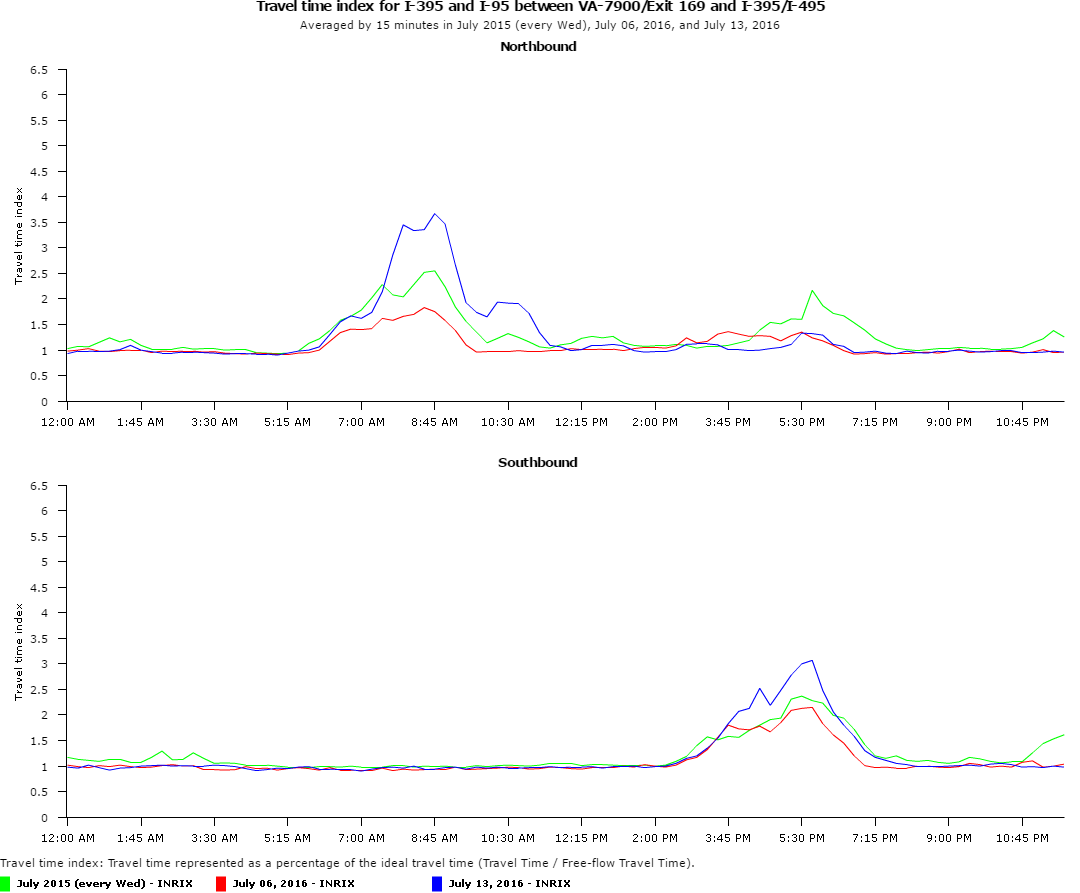
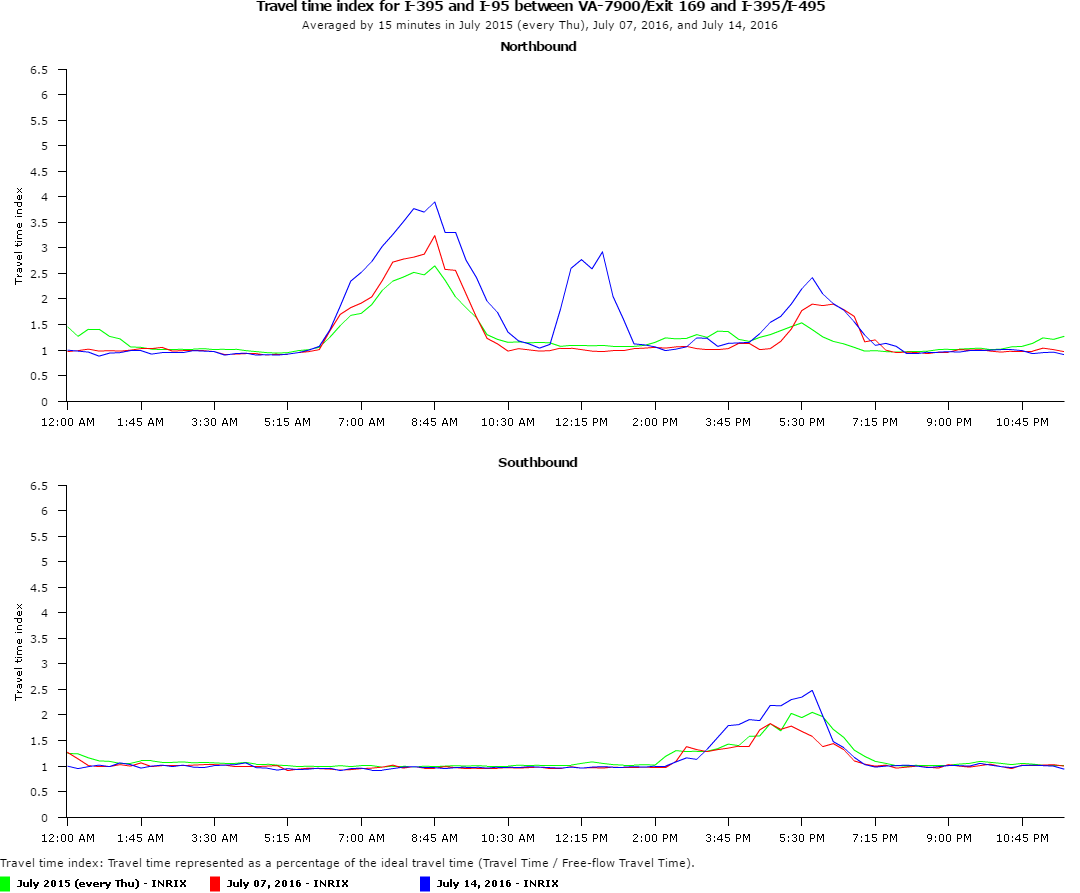
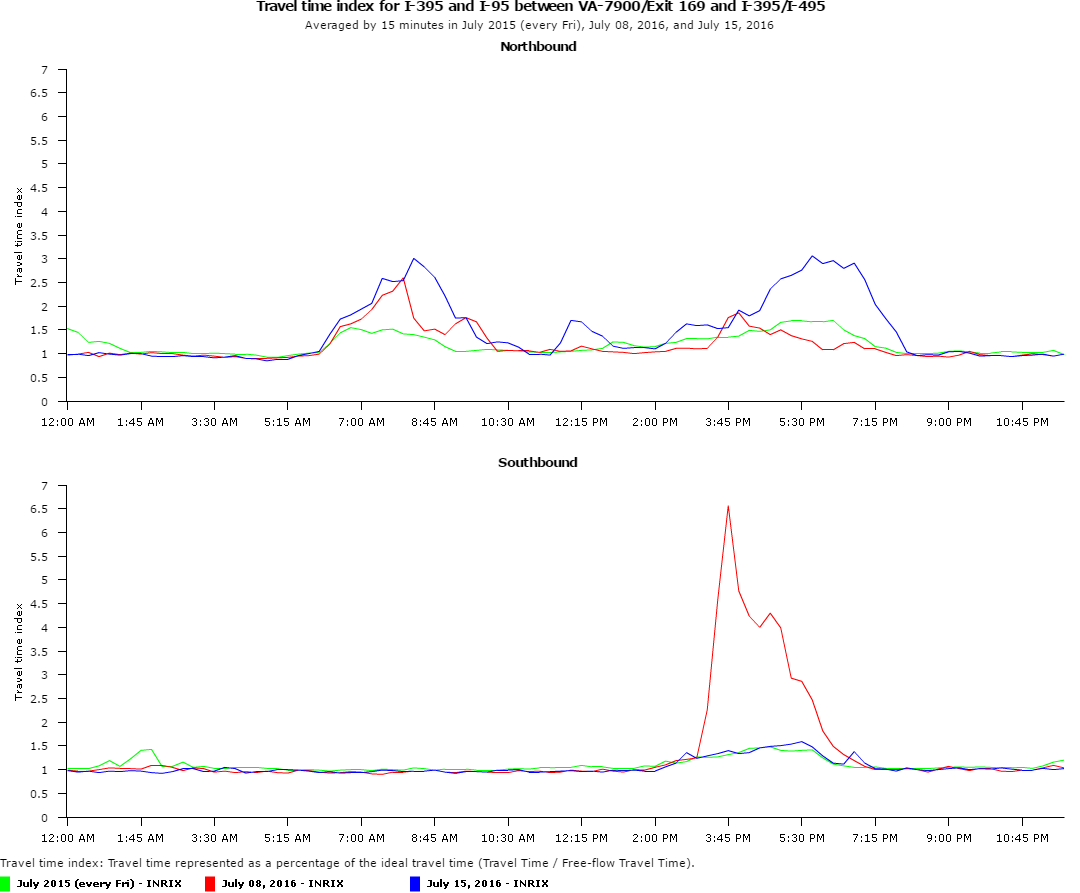
- Travel Time Index Comparison: I-95/395 between VA-7900 and the DC Line; Surge 3 (Red) vs Surge 4 (Blue) vs Average Week July 2015 (Green)
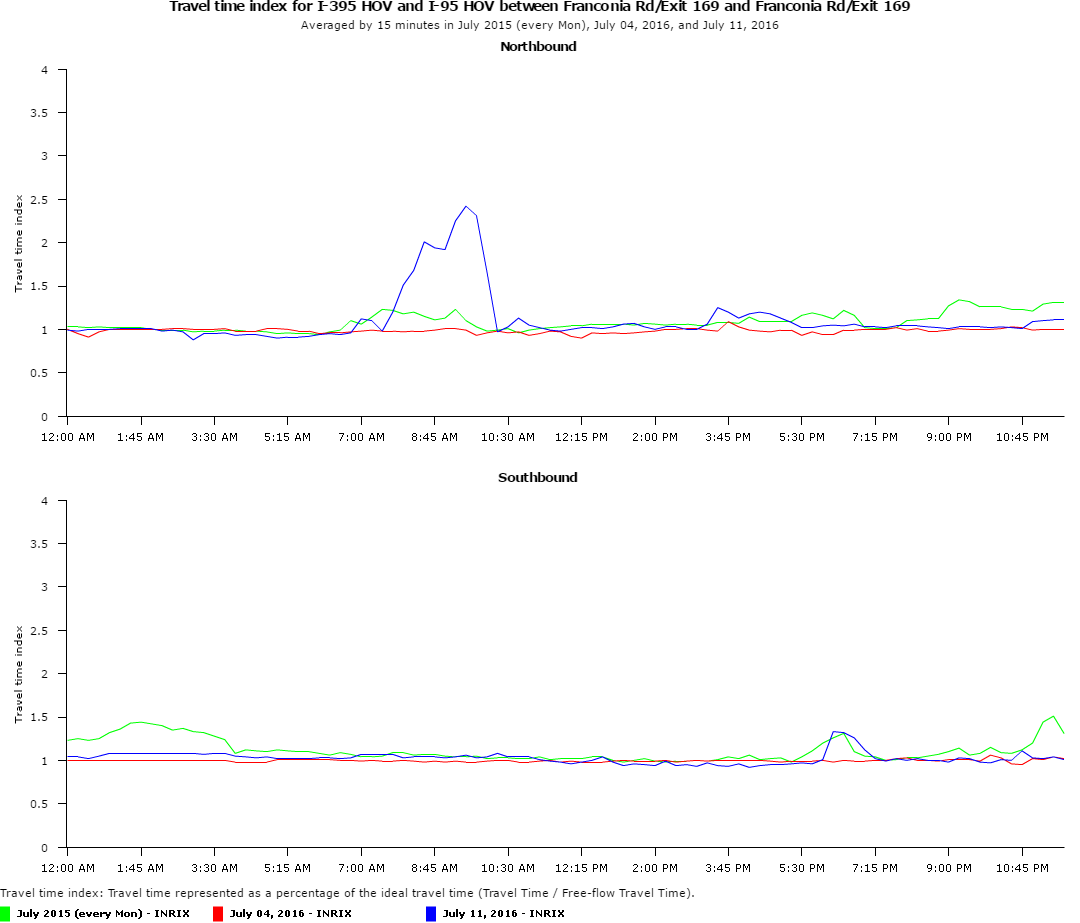
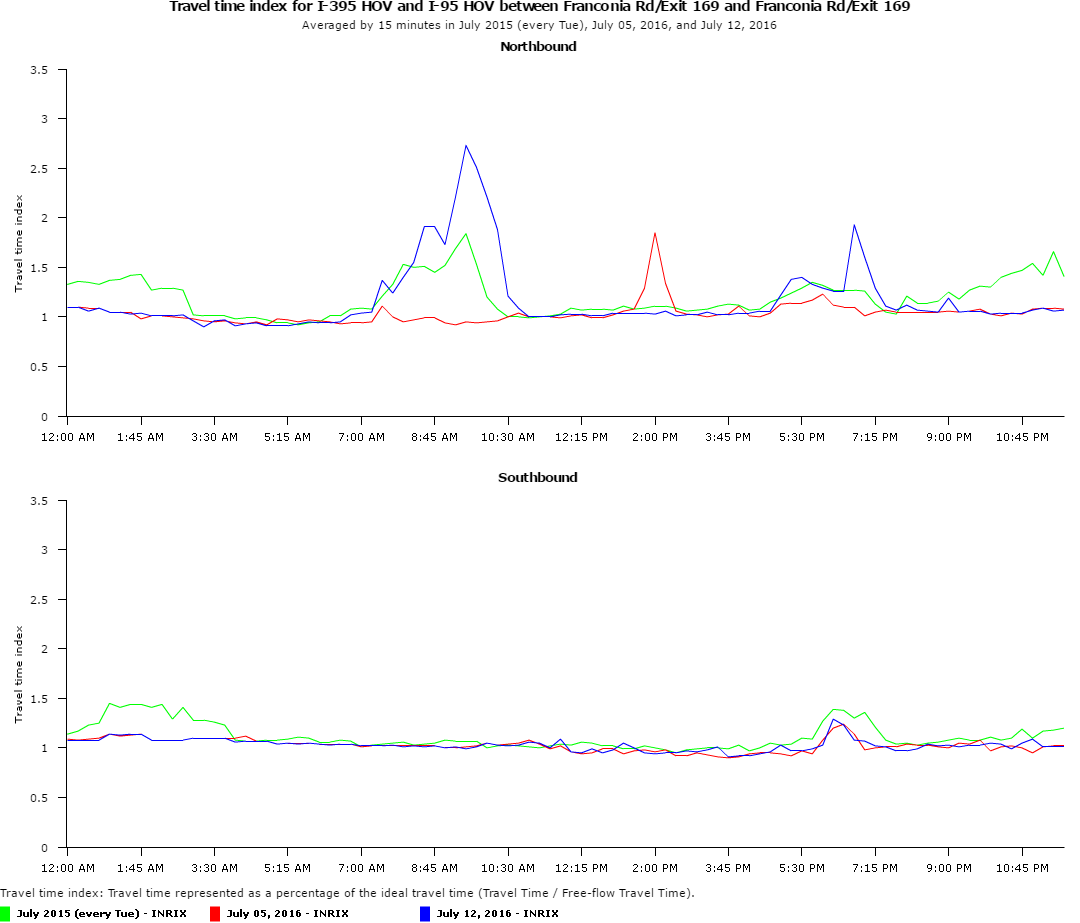
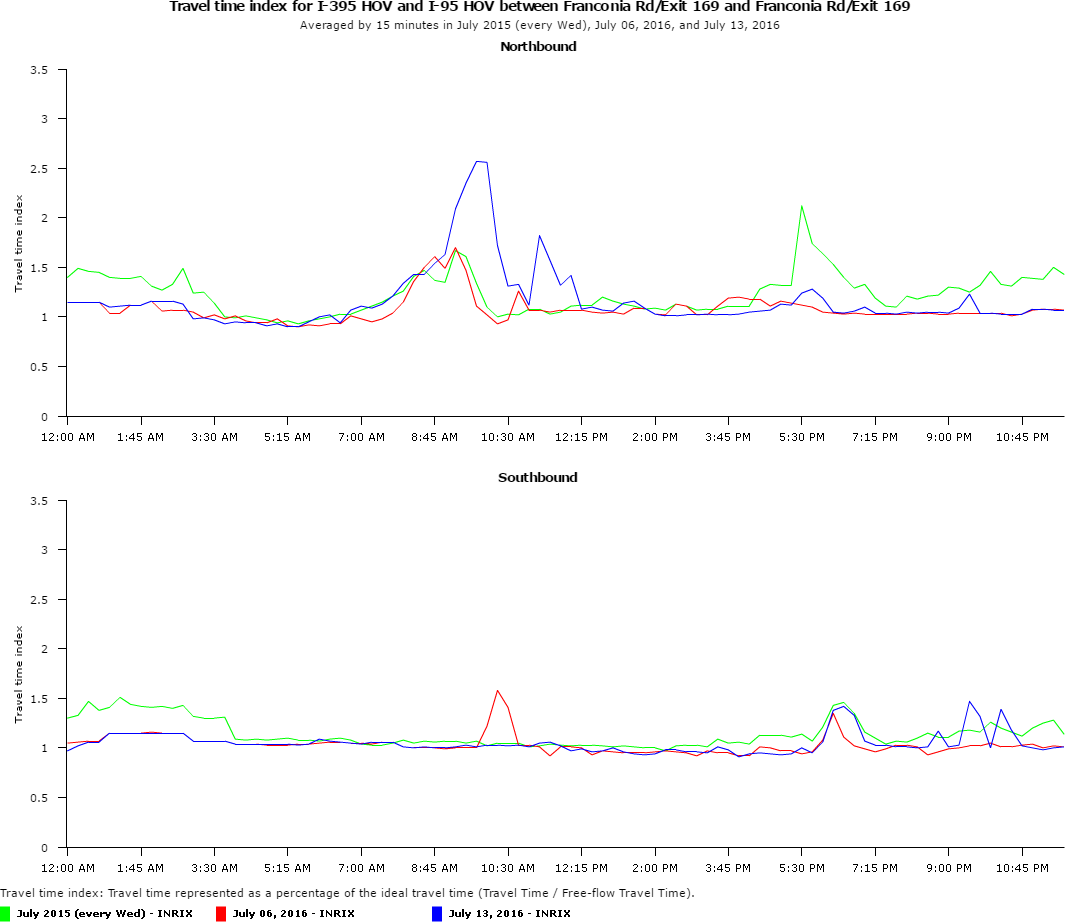
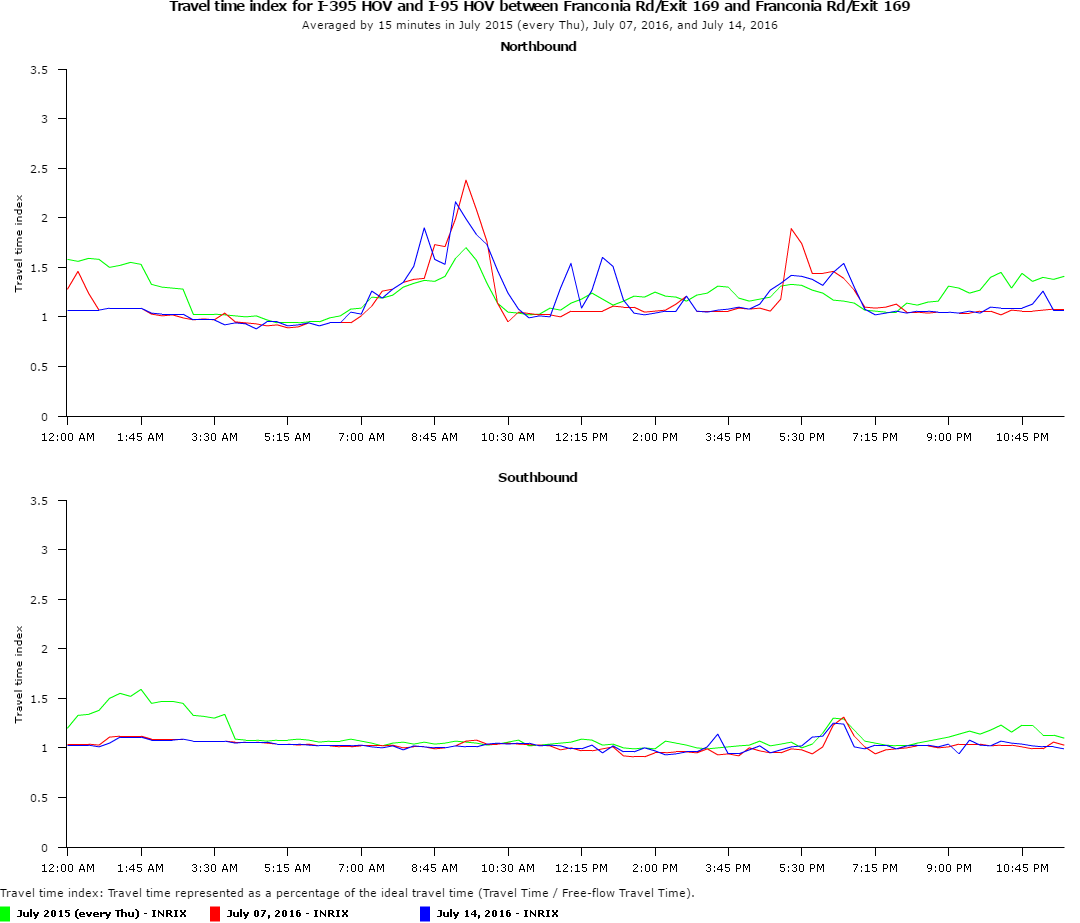
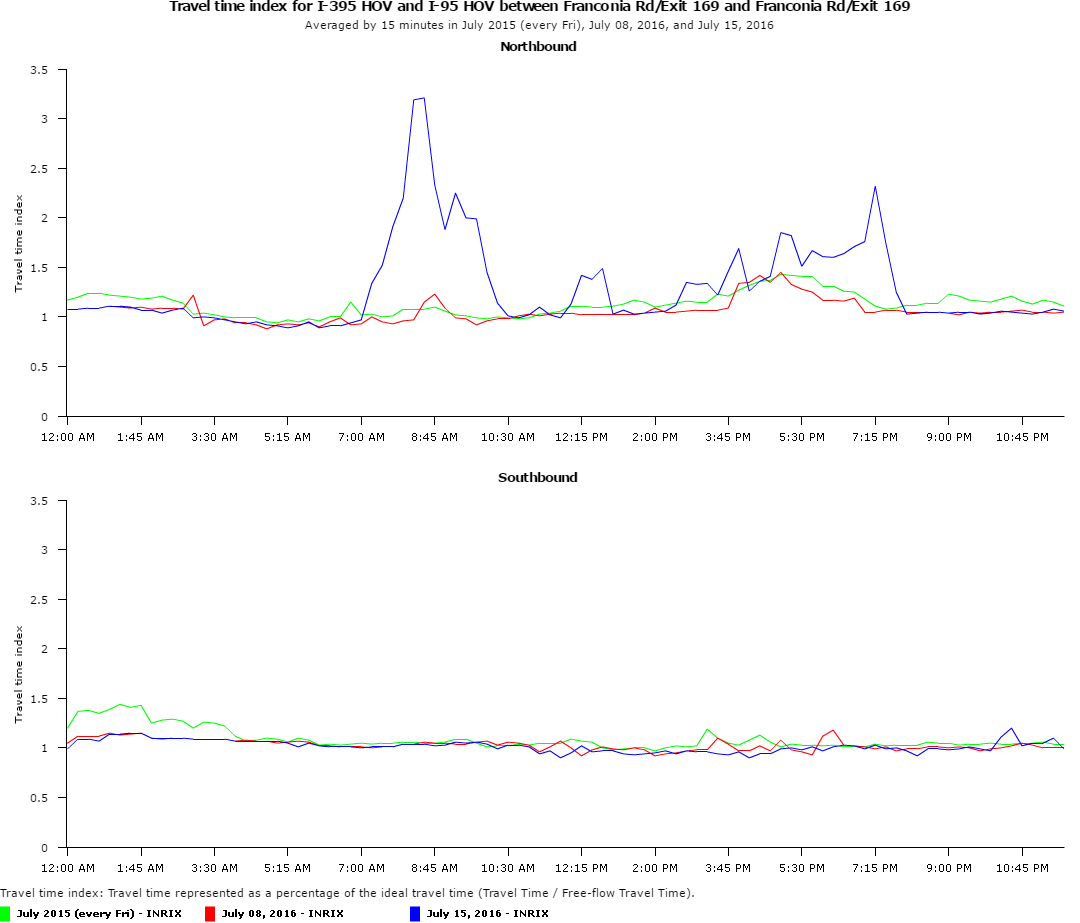
- Travel Time Index Comparison: I-95/395 HOV between VA-7900 and the DC Line; Surge 3 (Red) vs Surge 4 (Blue) vs Average Week July 2015 (Green)
WMATA Metrorail SafeTrack: Safety Surge #2 (June 18 – July 3, 2016)
Line segment shutdown of Orange, Silver and Blue line trains between 1) Eastern Market & Minnesota Ave/Benning Road and 2) between Arlington Cemetery and Rosslyn from June 18 through July 3, 2016.
Download all trend map links & performance charts for Safety Surge #2 (pdf)
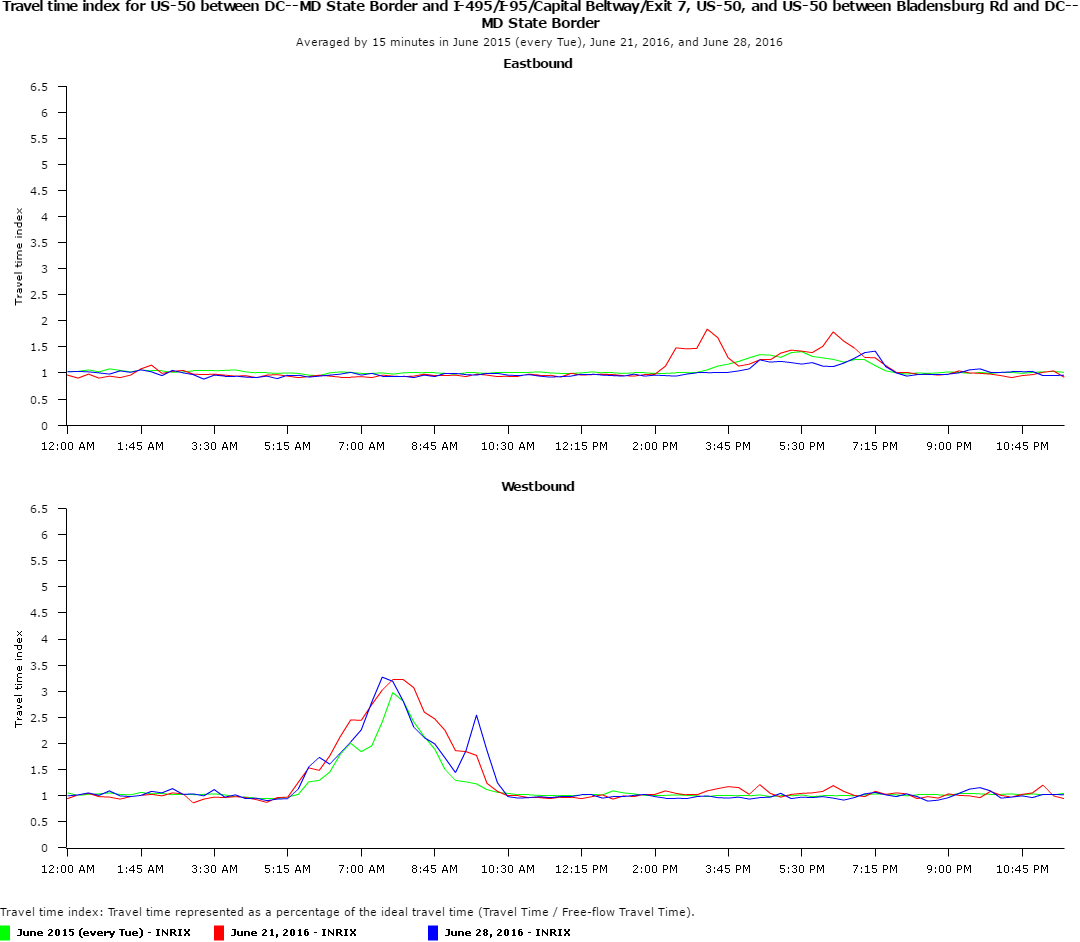
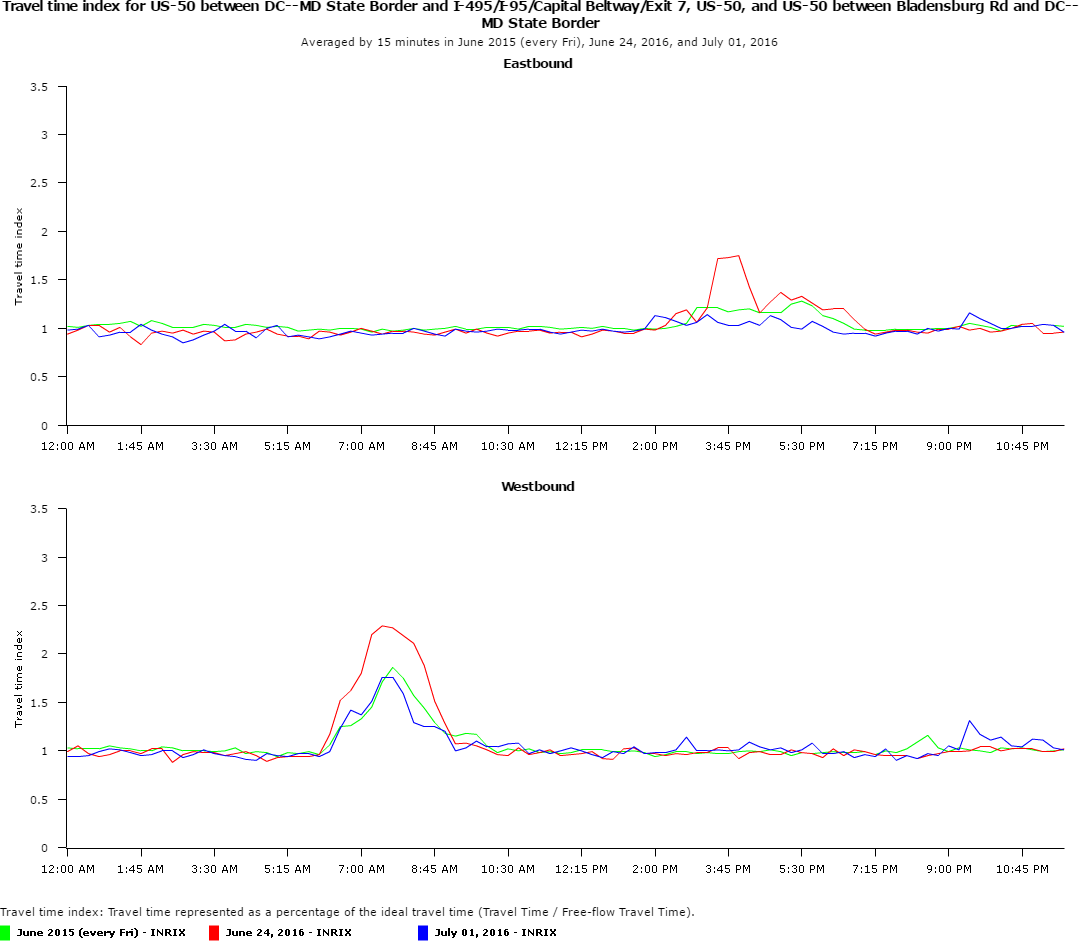
- Travel Time Index Comparison: US-50 between the Capital Beltway and Bladdensburg Rd; Week 1 (Red) vs Week 2 (Blue) vs Average Week June 2015 (Green)


- Travel Time Index Comparison: Central Ave/East Capitol between the Capital Beltway and Whitney Young Bridge; Week 1 (Red) vs Week 2 (Blue) vs Average Week June 2015 (Green)


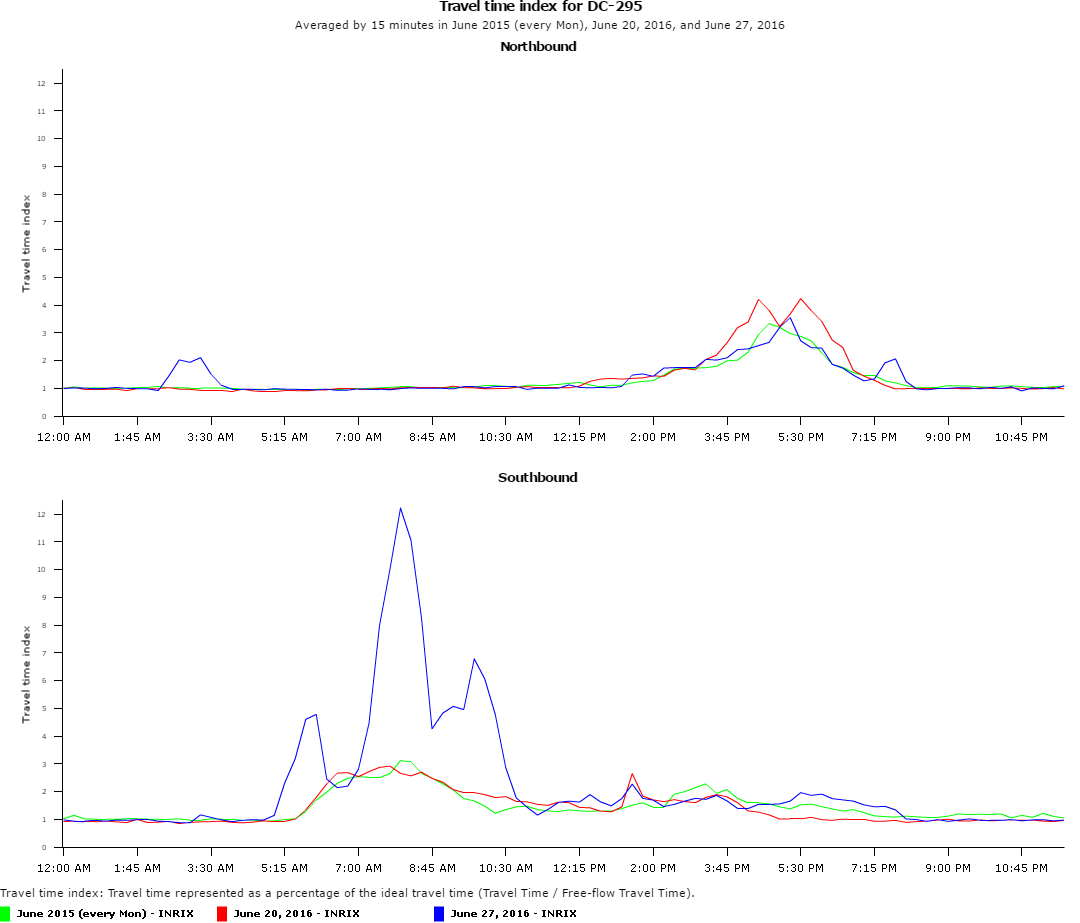
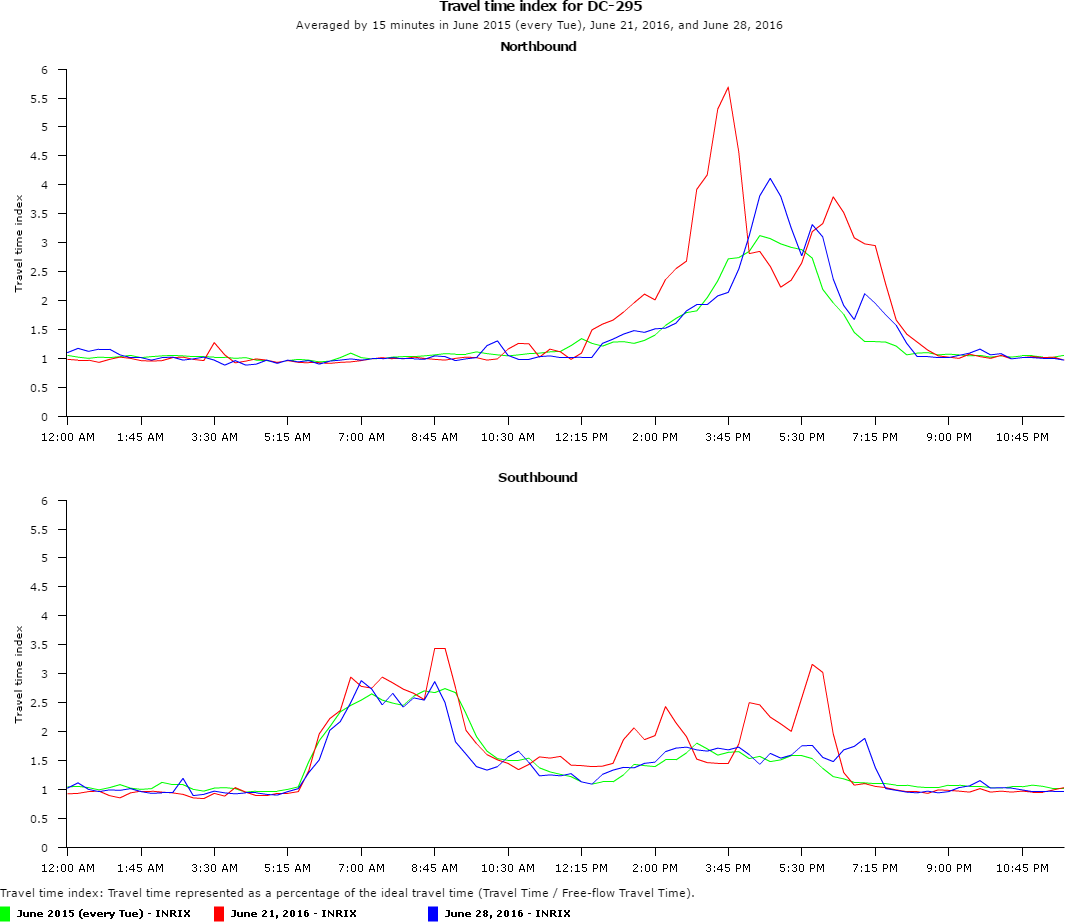
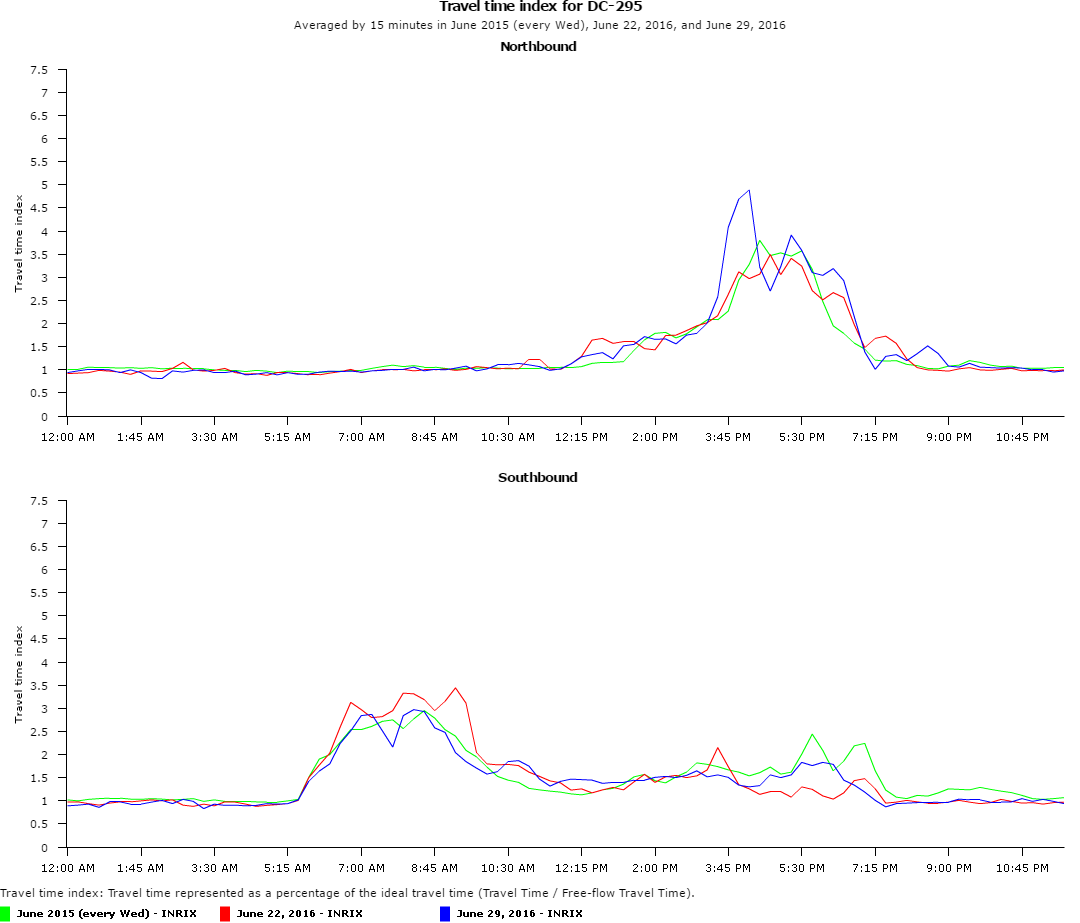
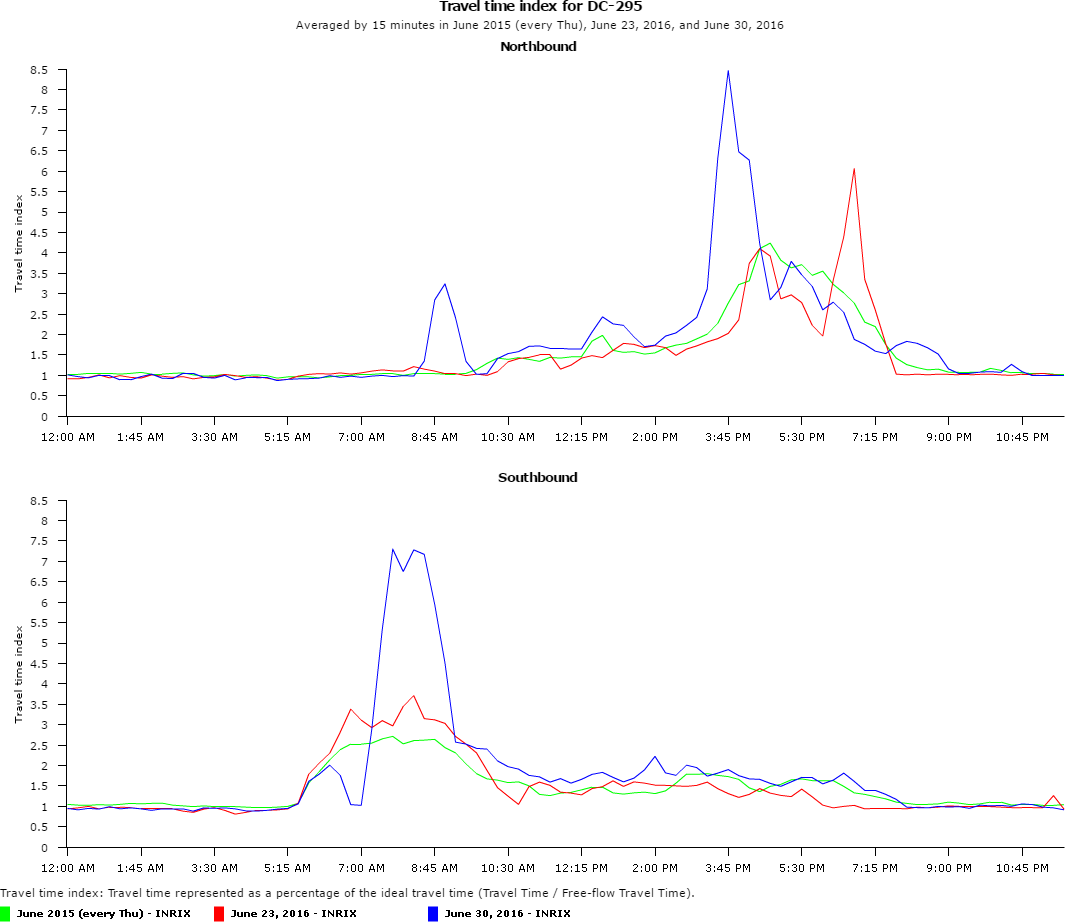
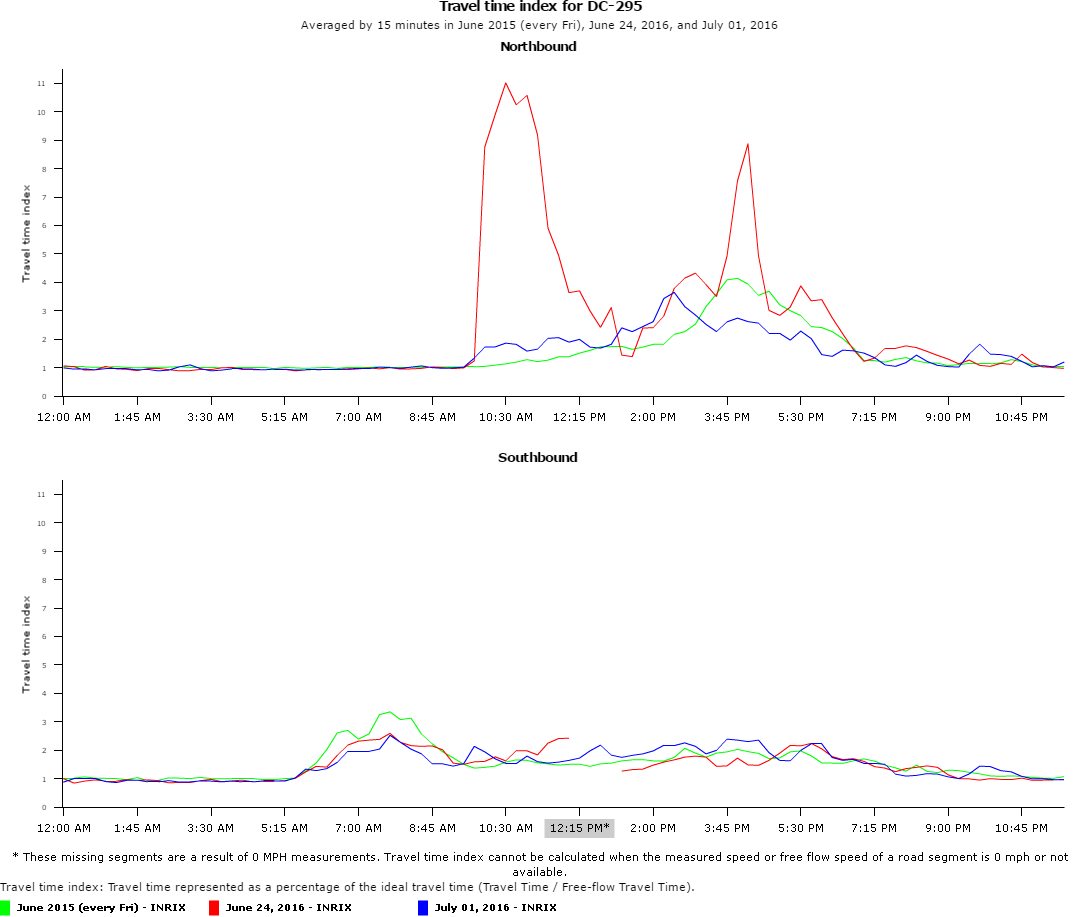
- Travel Time Index Comparison: DC-295 between the Eastern Avenue and 11th Street Bridge; Week 1 (Red) vs Week 2 (Blue) vs Average Week June 2015 (Green)
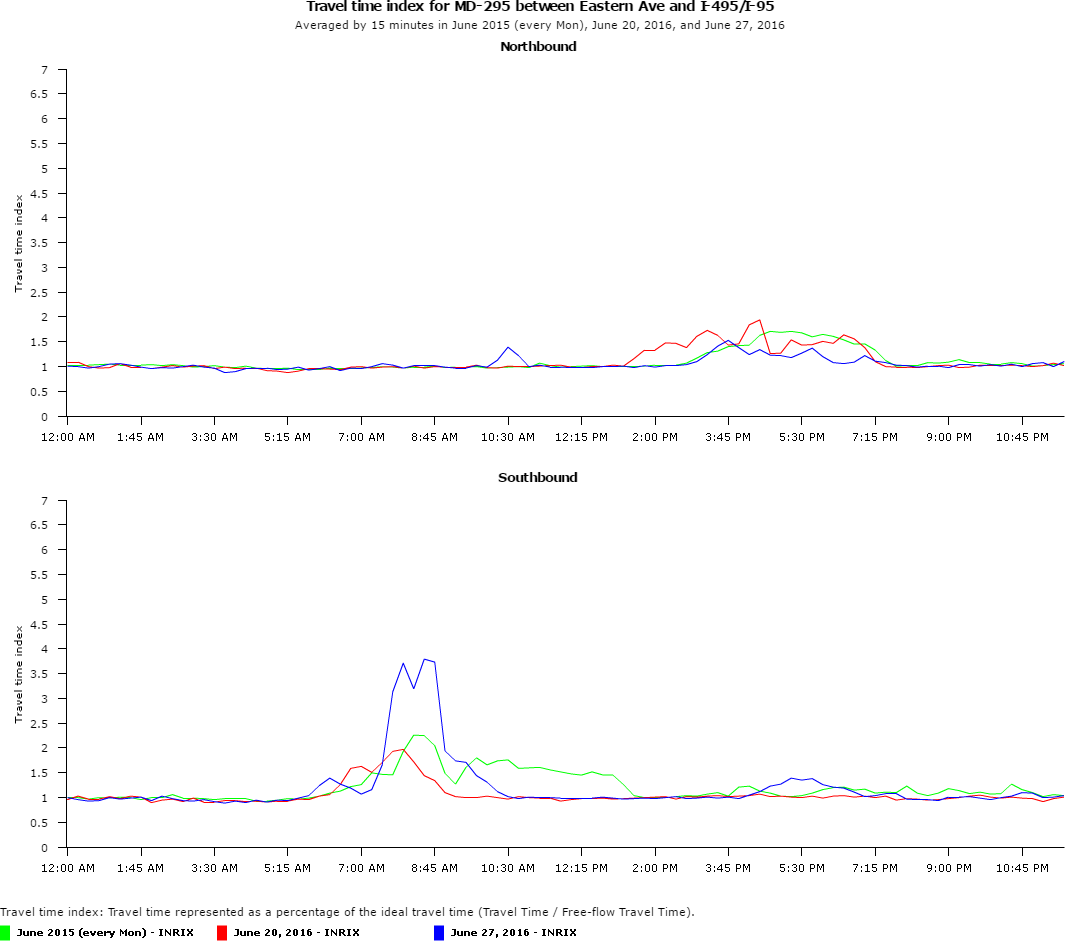
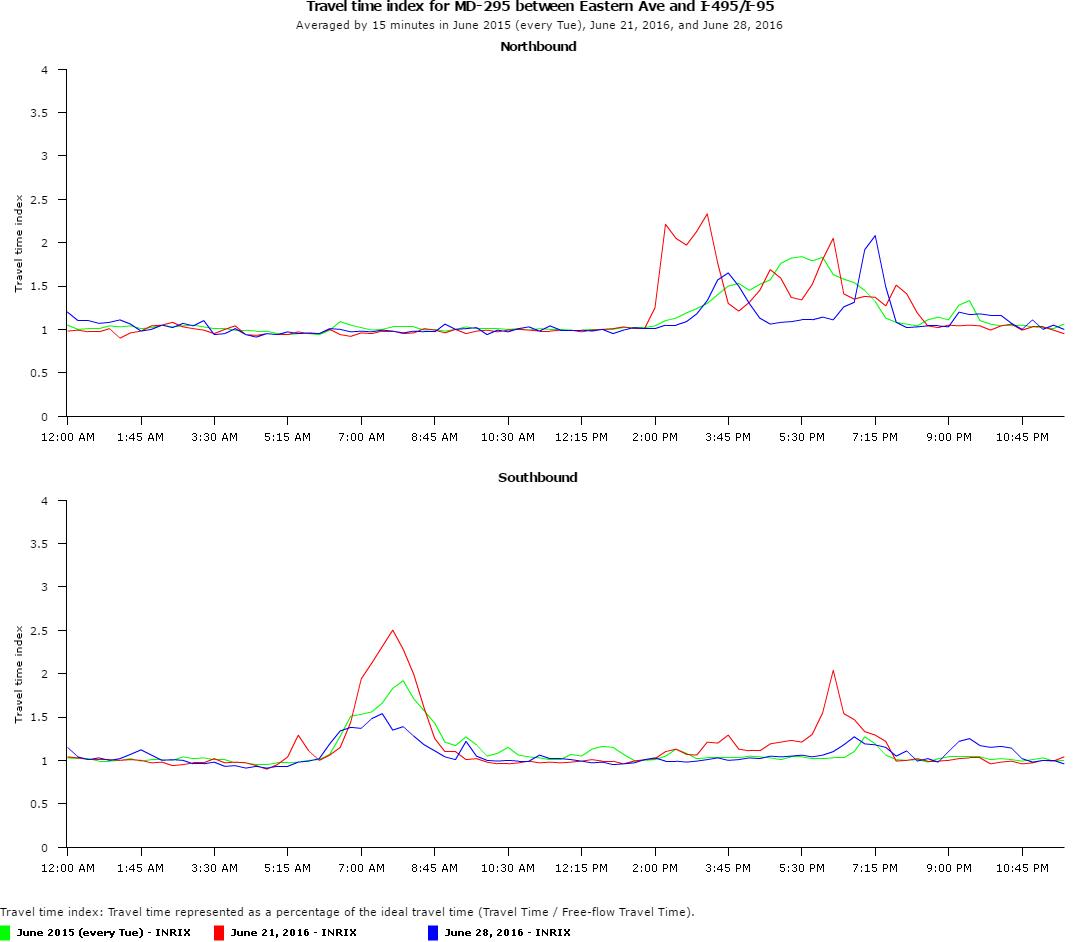
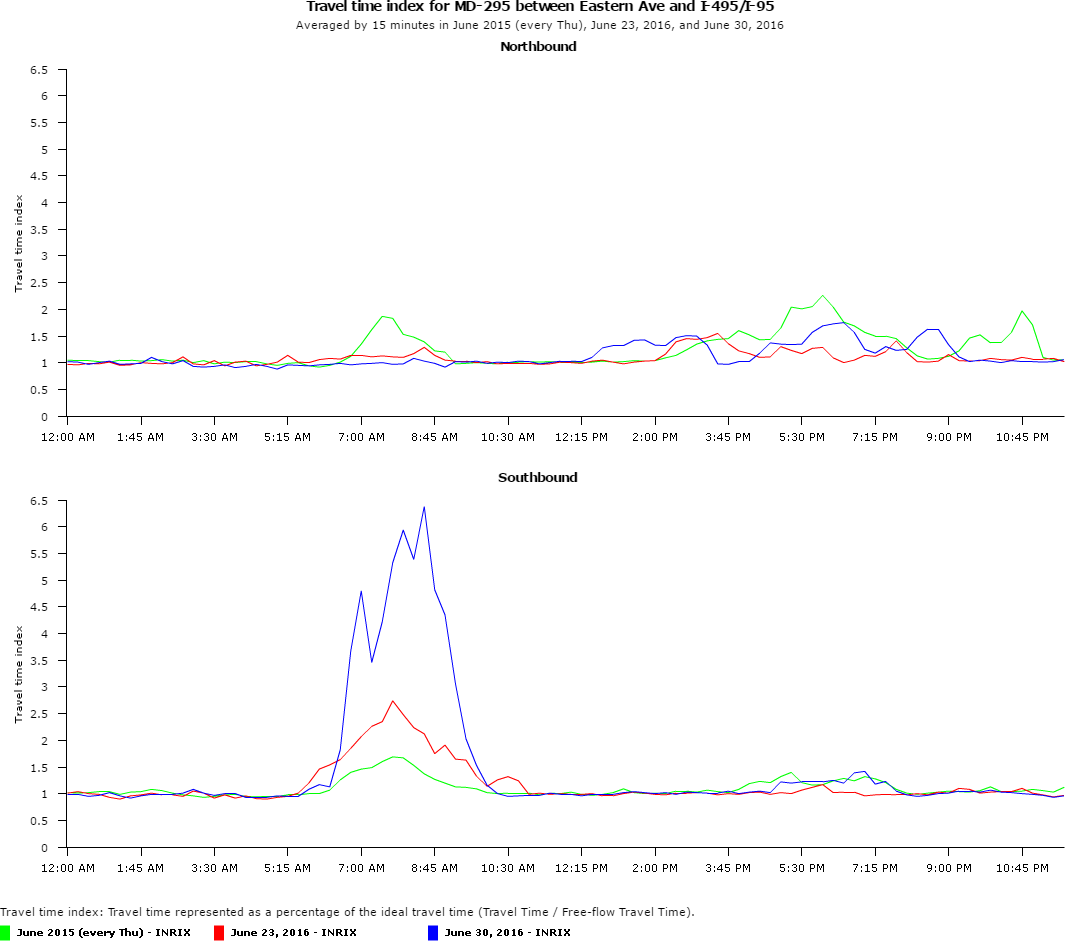
- Travel Time Index Comparison: MD-295 between the Capital Beltway and Eastern Avenue; Week 1 (Red) vs Week 2 (Blue) vs Average Week June 2015 (Green)
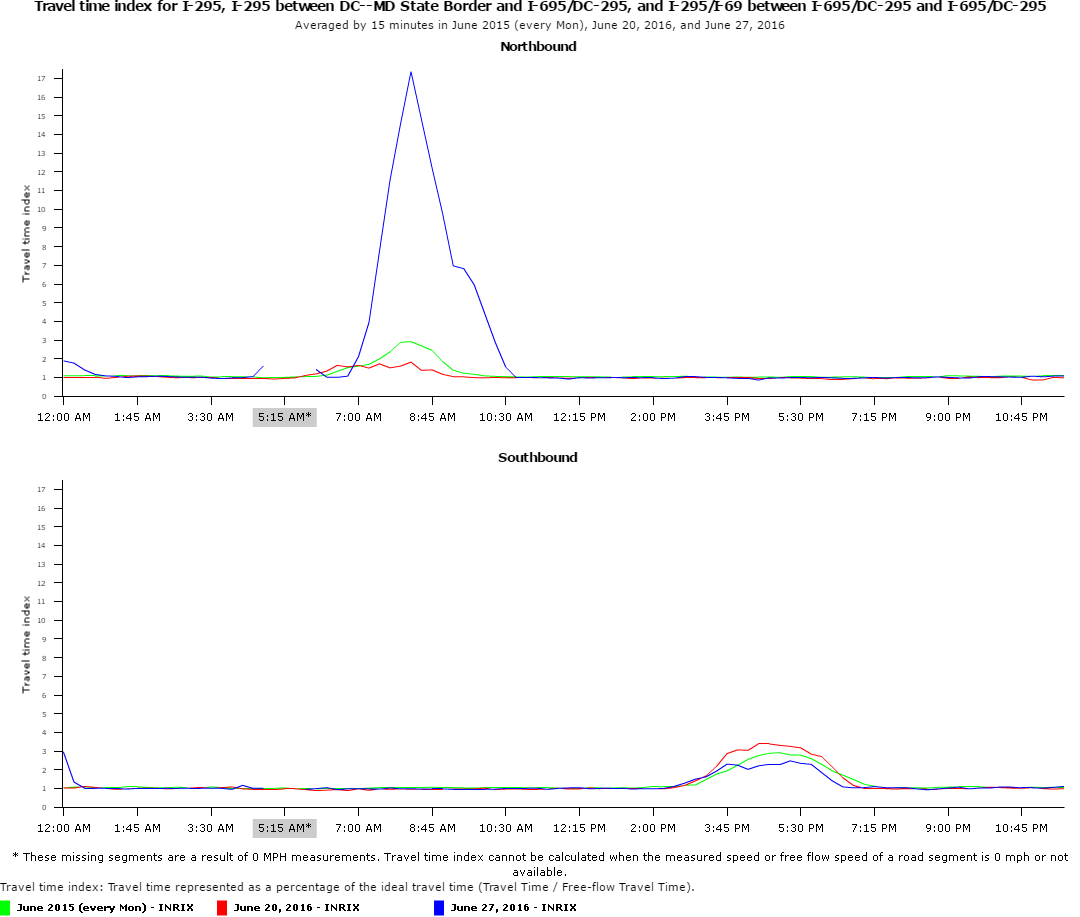
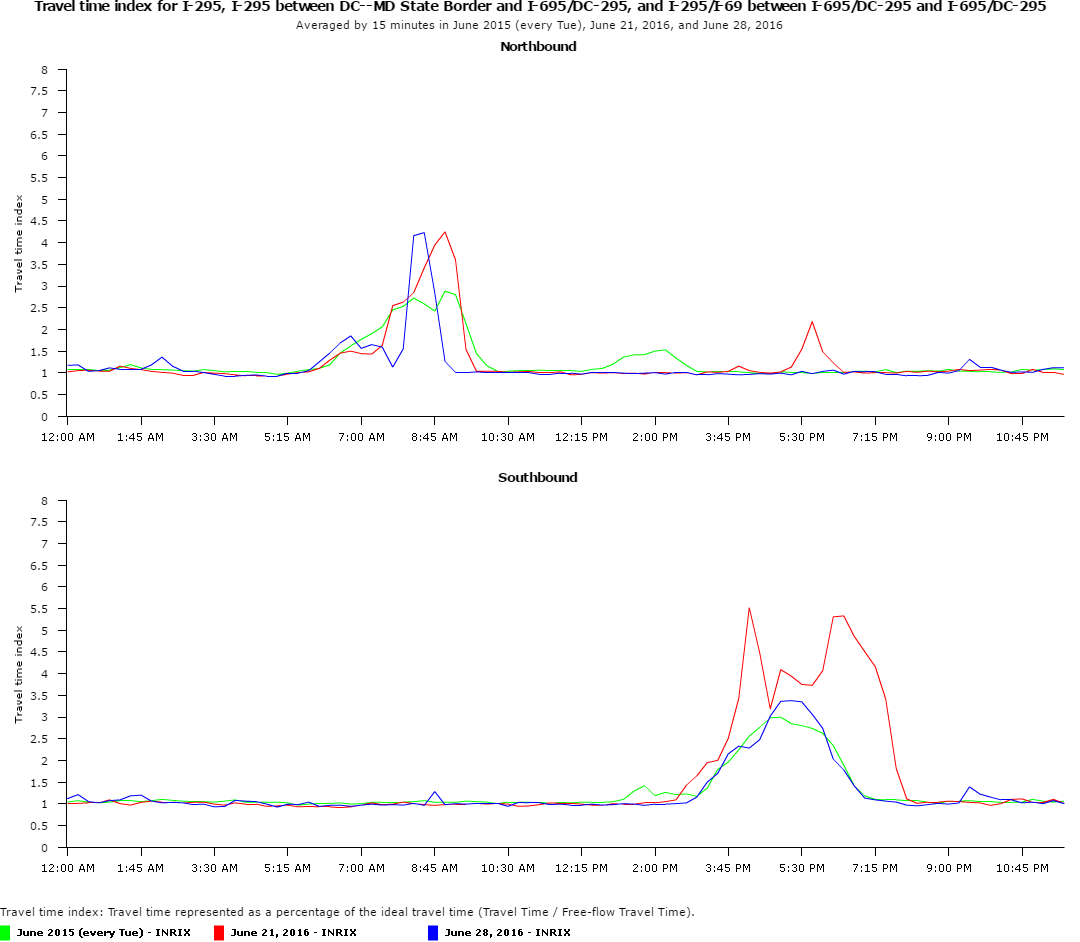
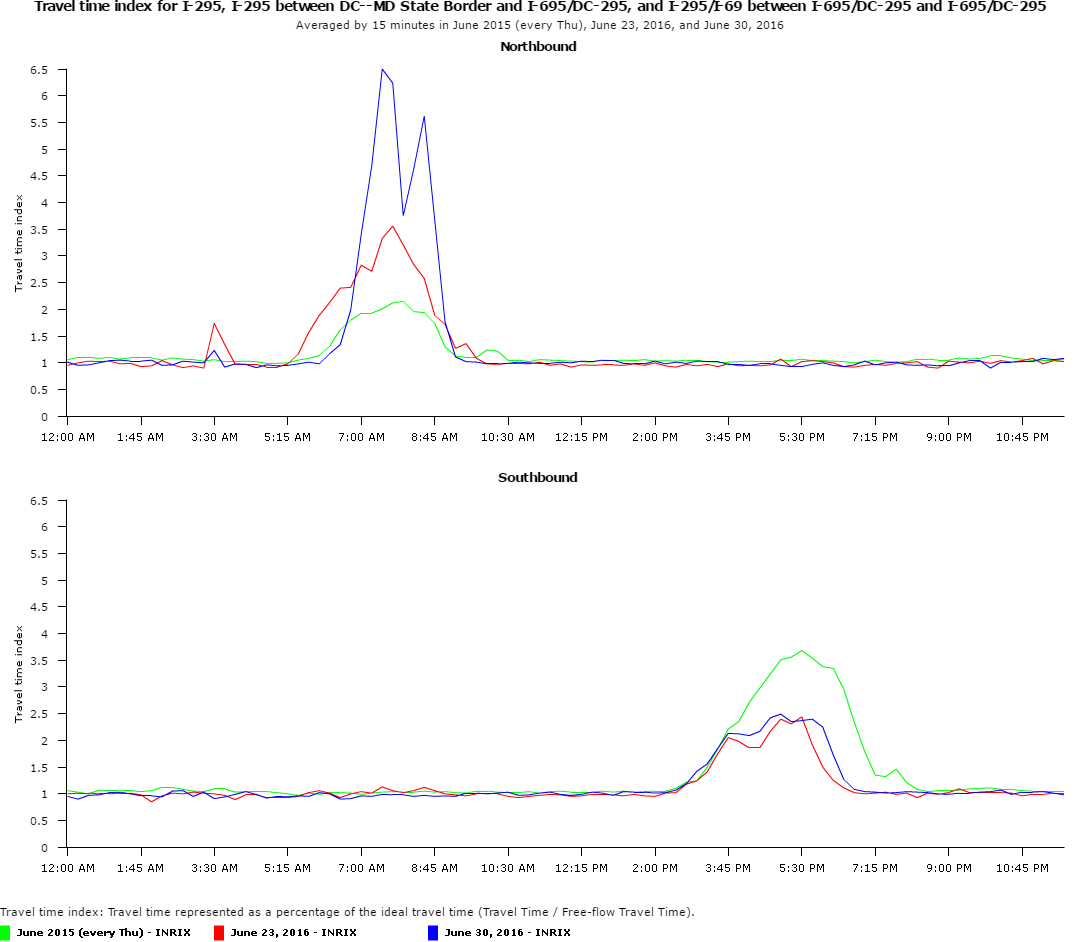
- Travel Time Index Comparison: I-295 between the Capital Beltway and 11th Street Bridge; Week 1 Week 1 (Red) vs Week 2 (Blue) vs Average Week June 2015 (Green)


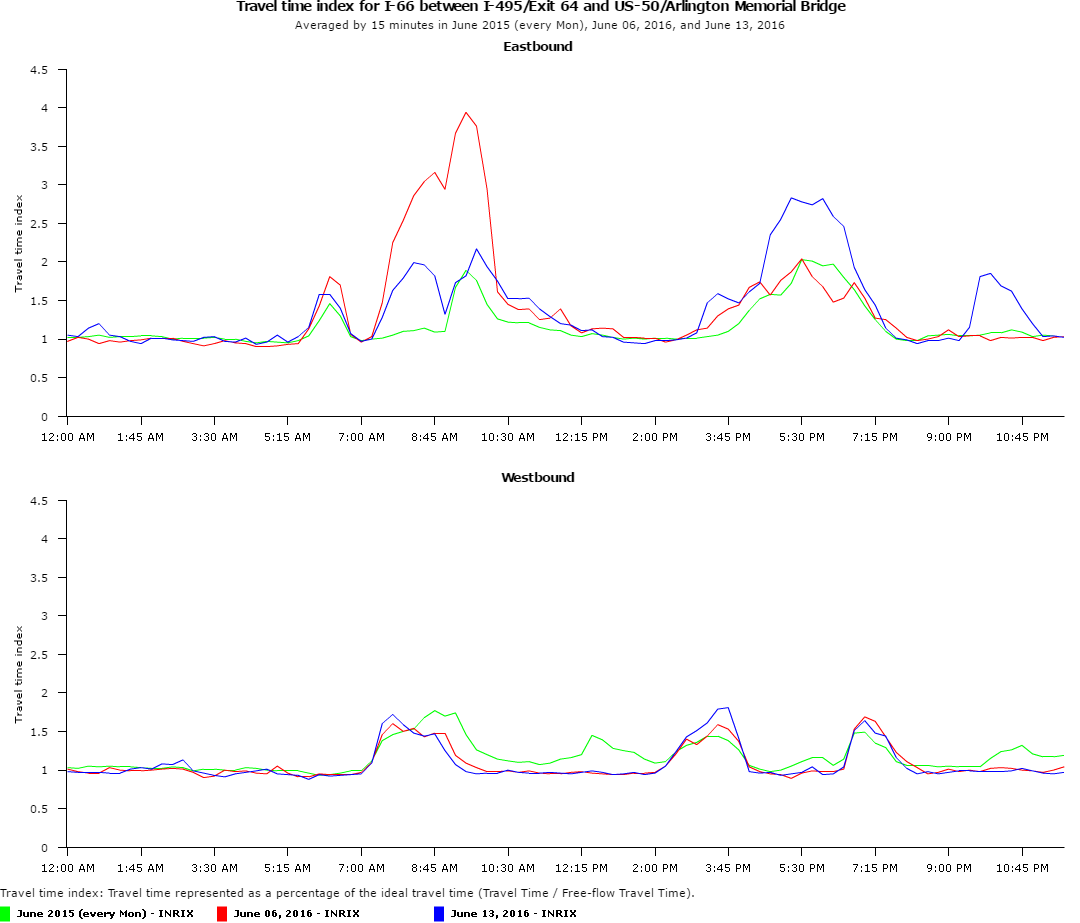
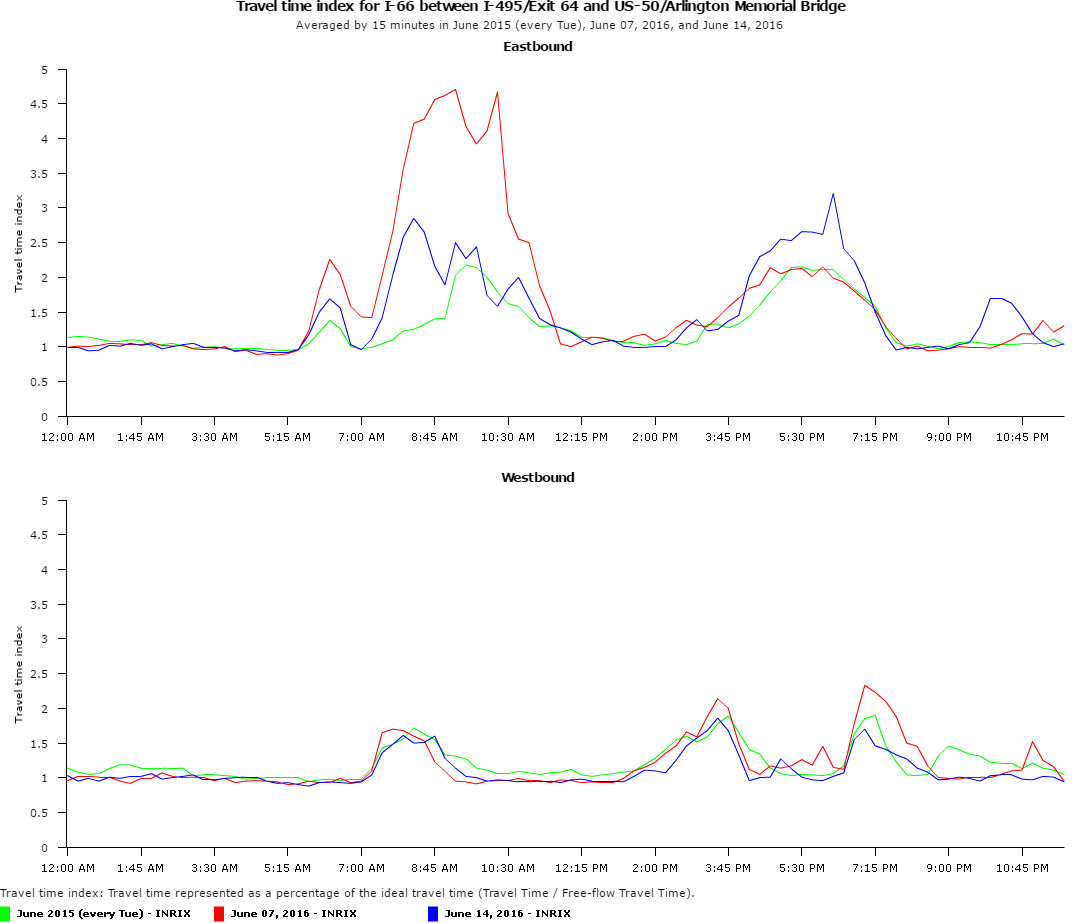
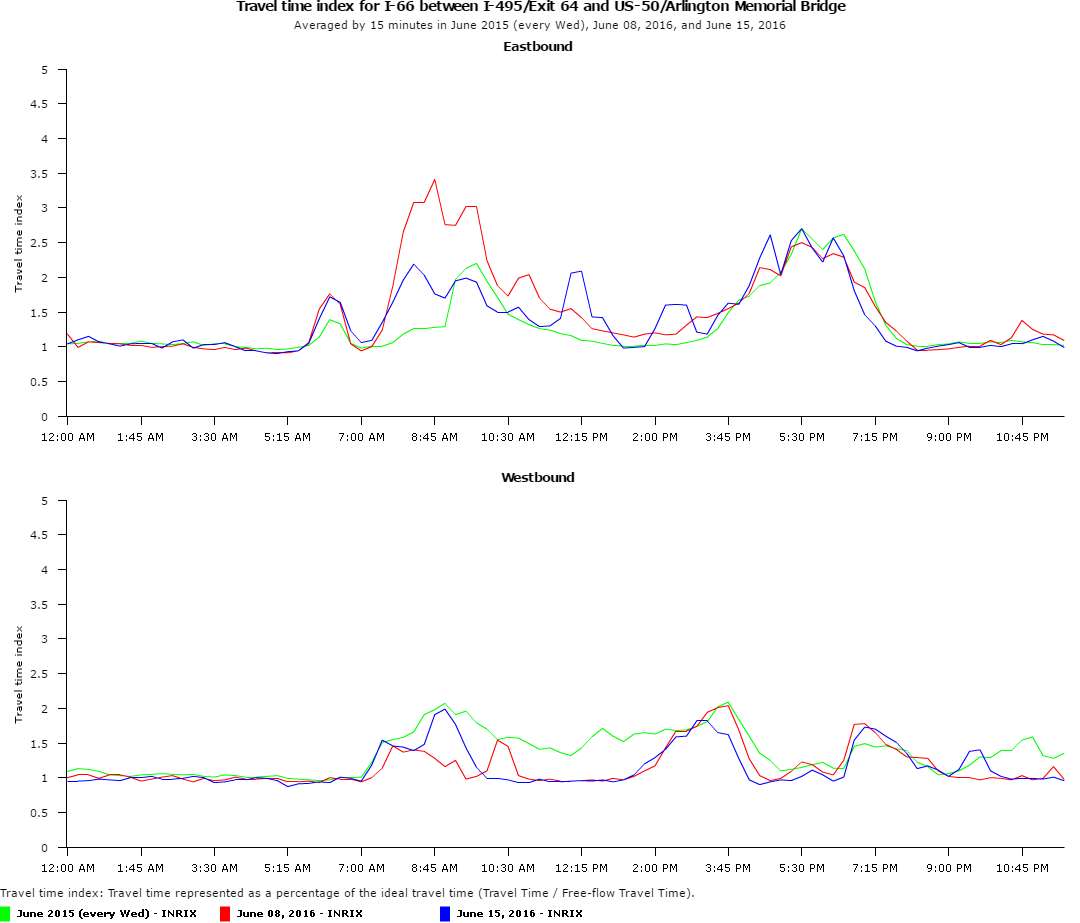
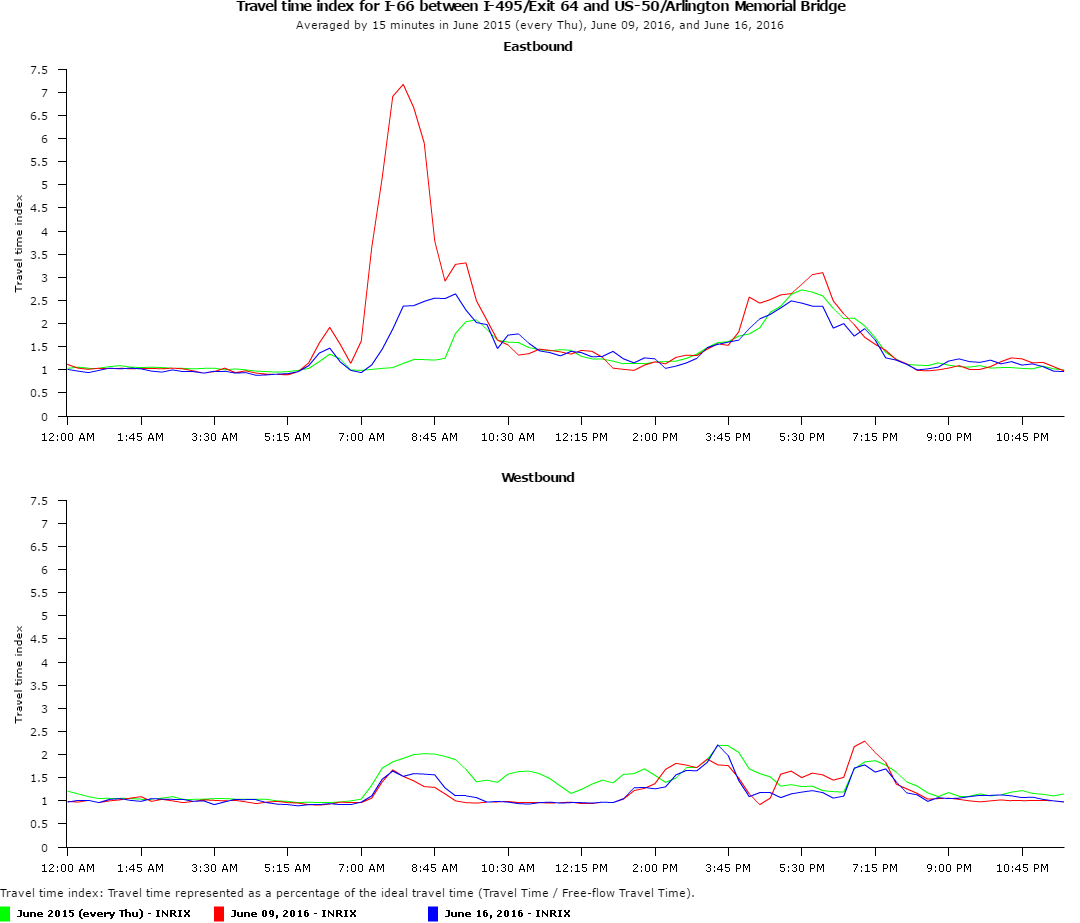
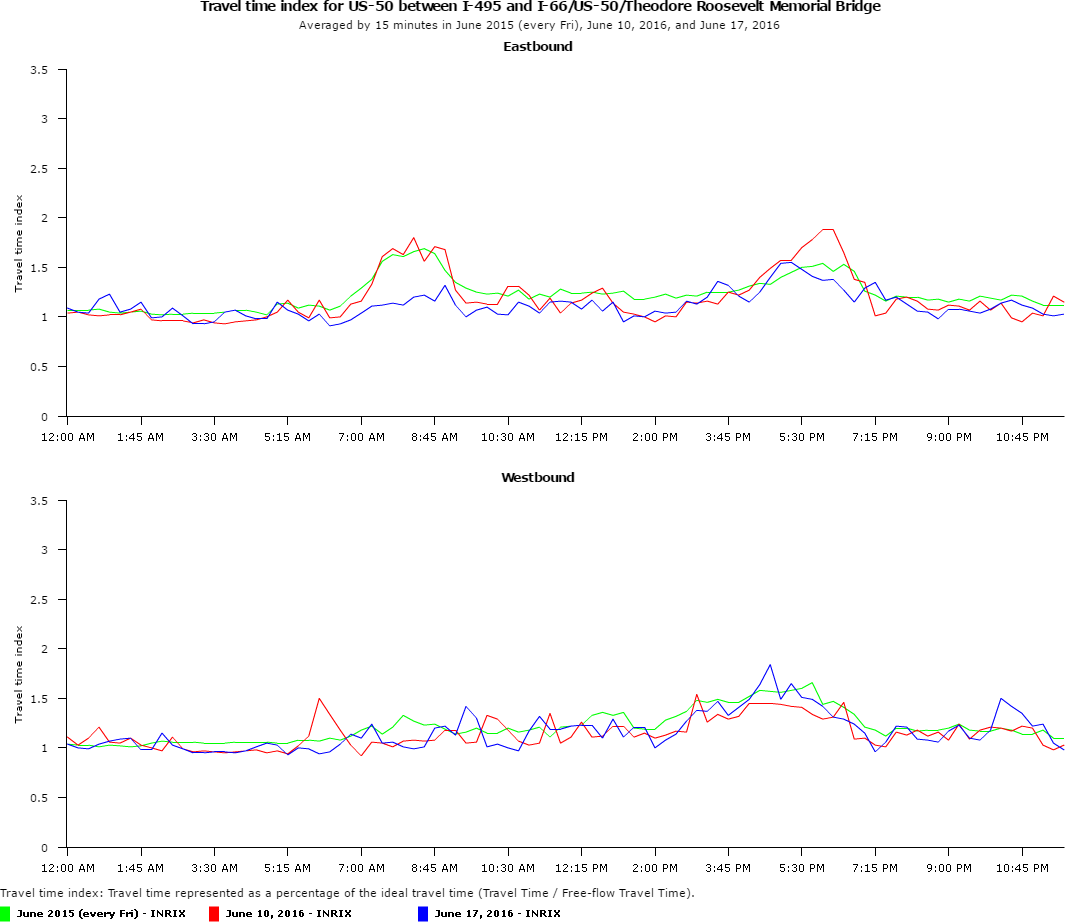
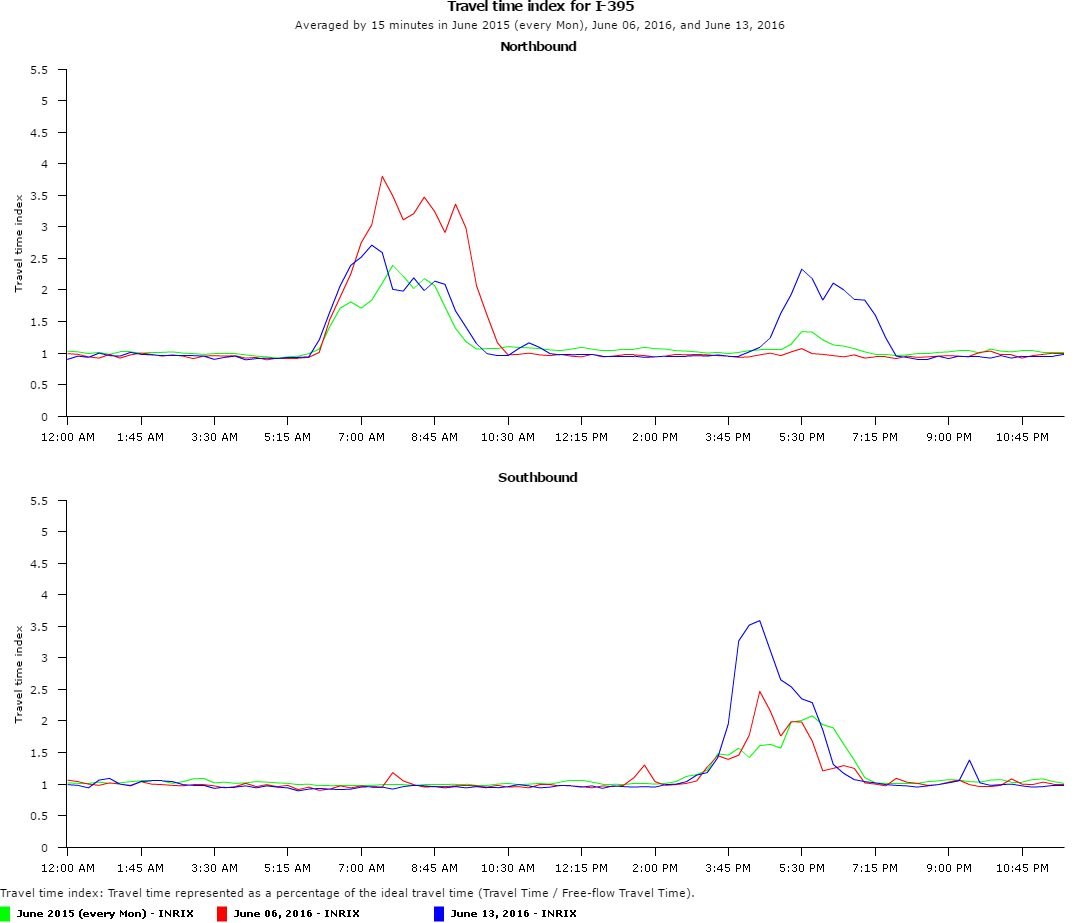
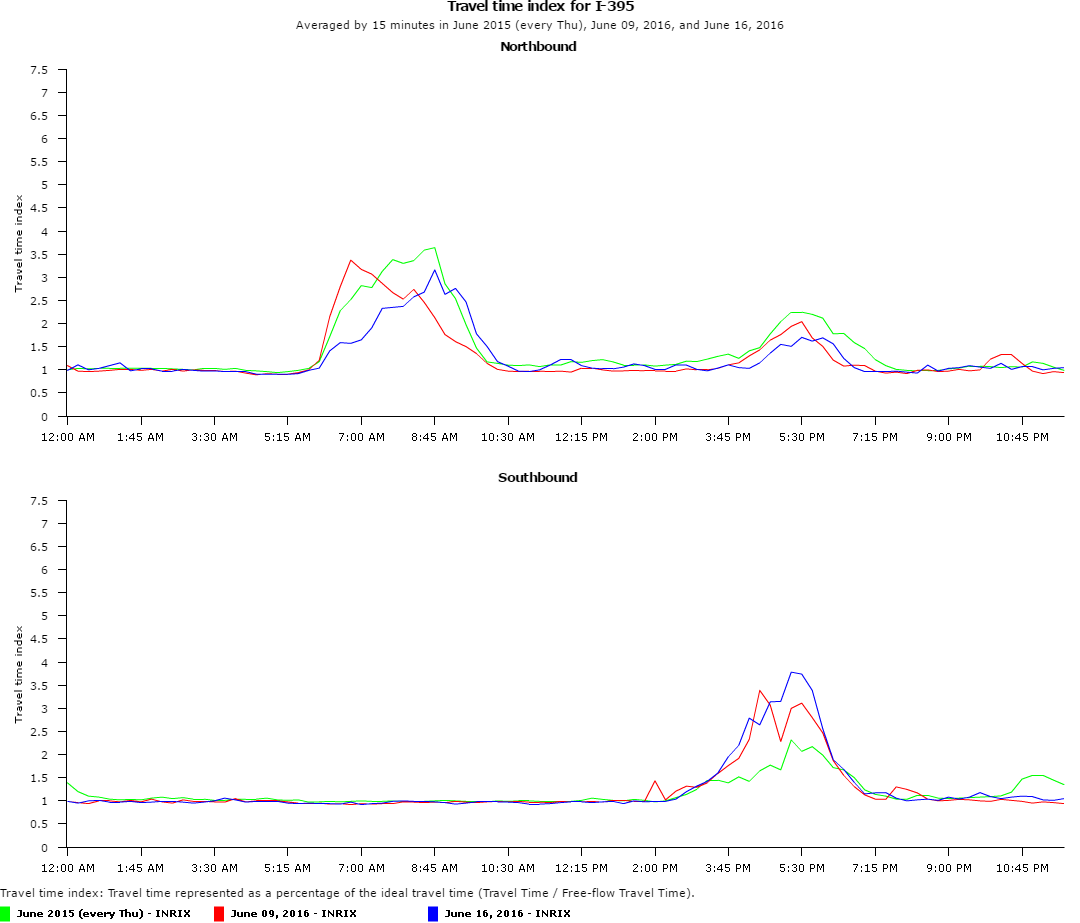
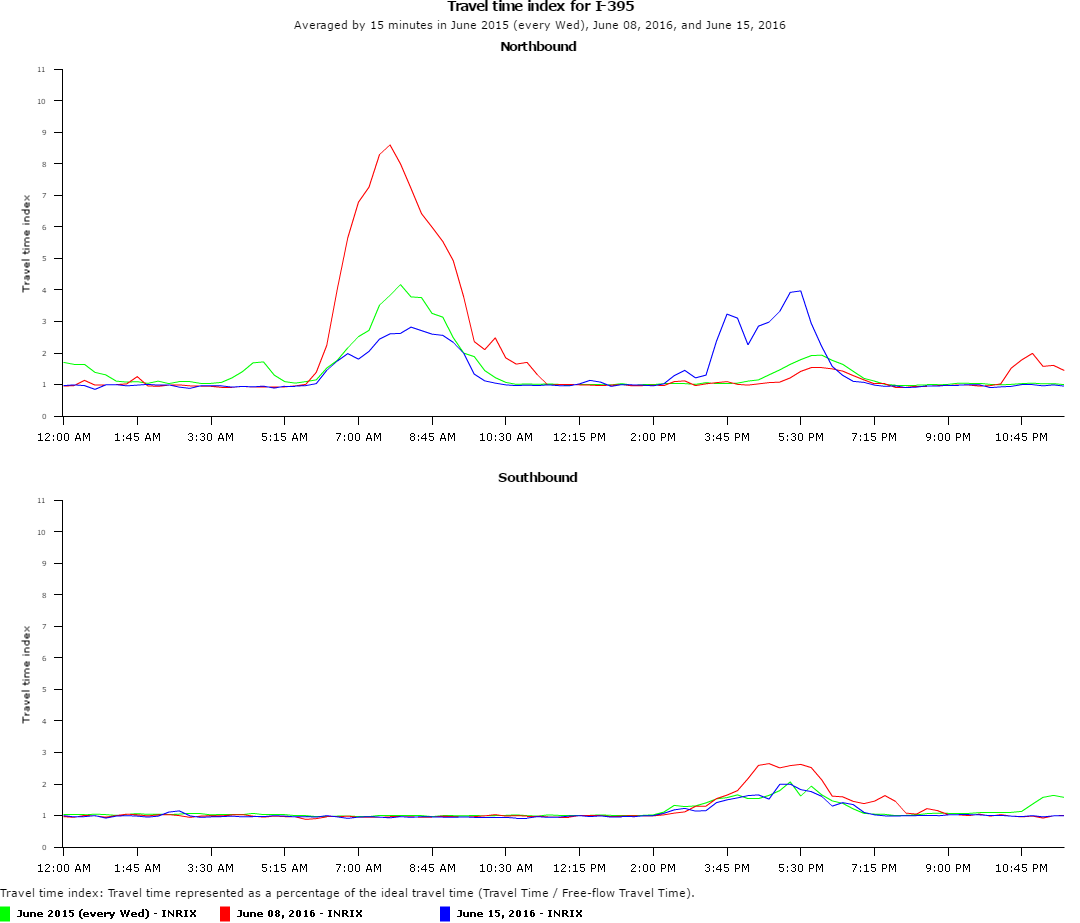
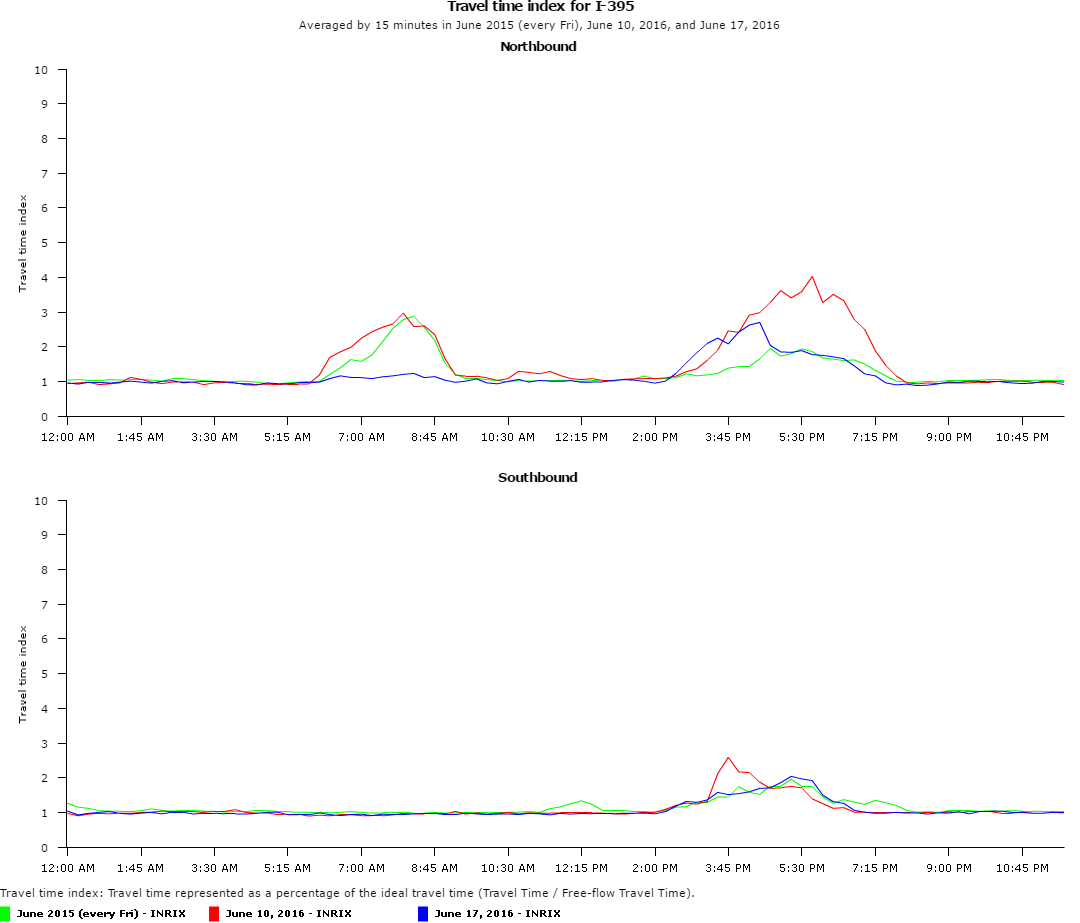
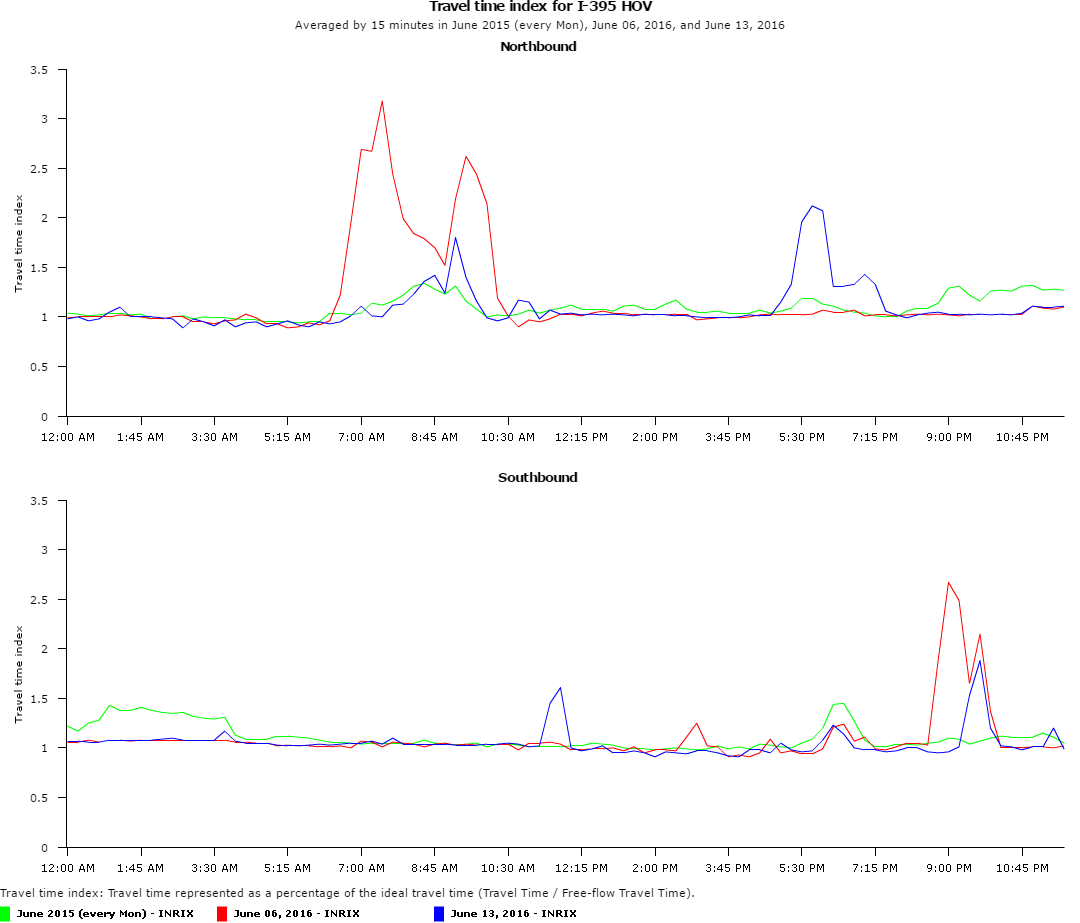
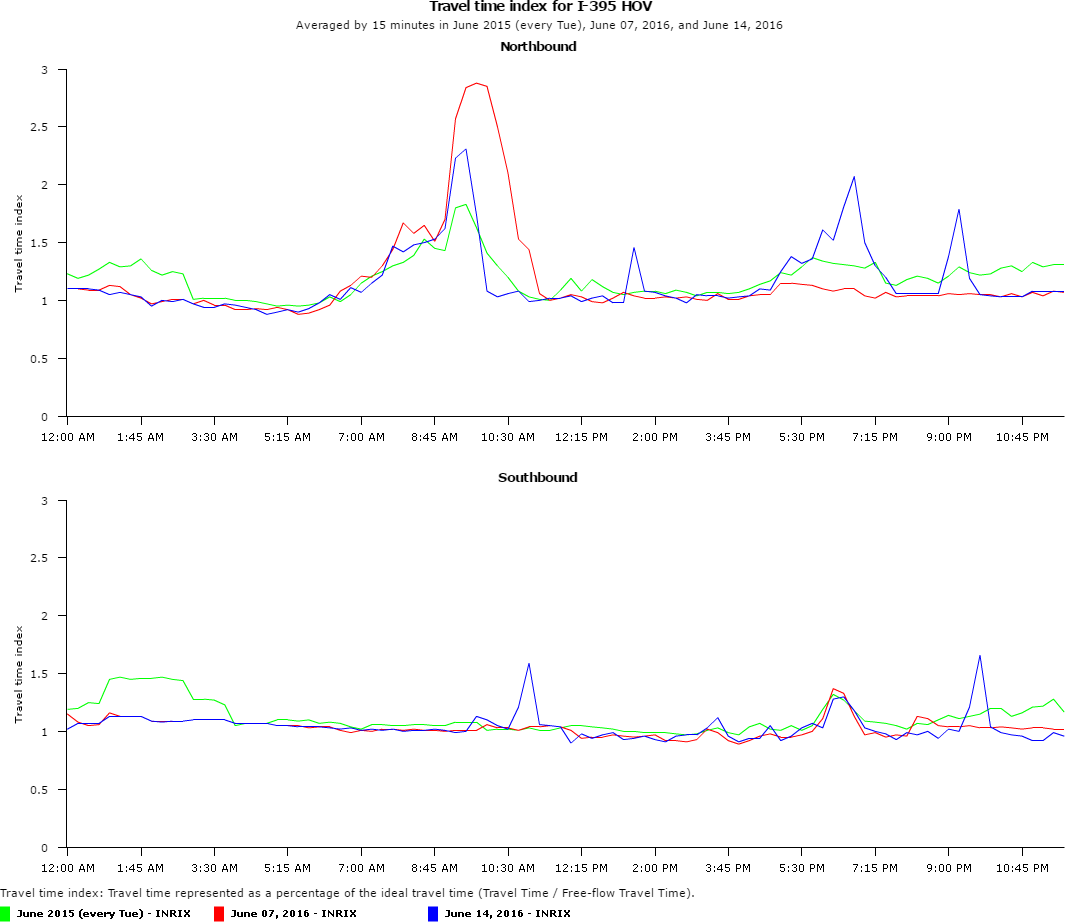
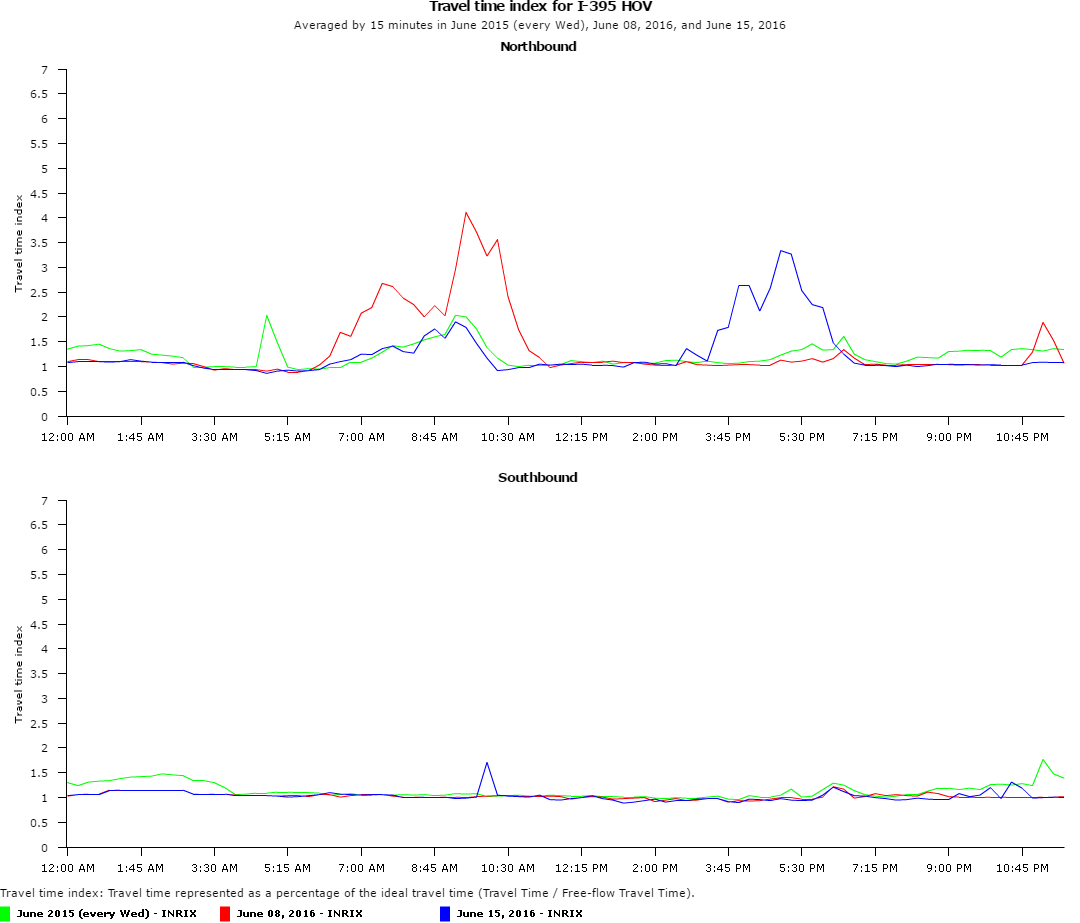
WMATA Metrorail SafeTrack: Safety Surge #1 (June 4-16, 2016)
Continuous single tracking of Orange and Silver line trains between East Falls Church and Ballston from June 4 through June 16, 2016
Download all trend map links & performance charts for Safety Surge #1 (pdf)
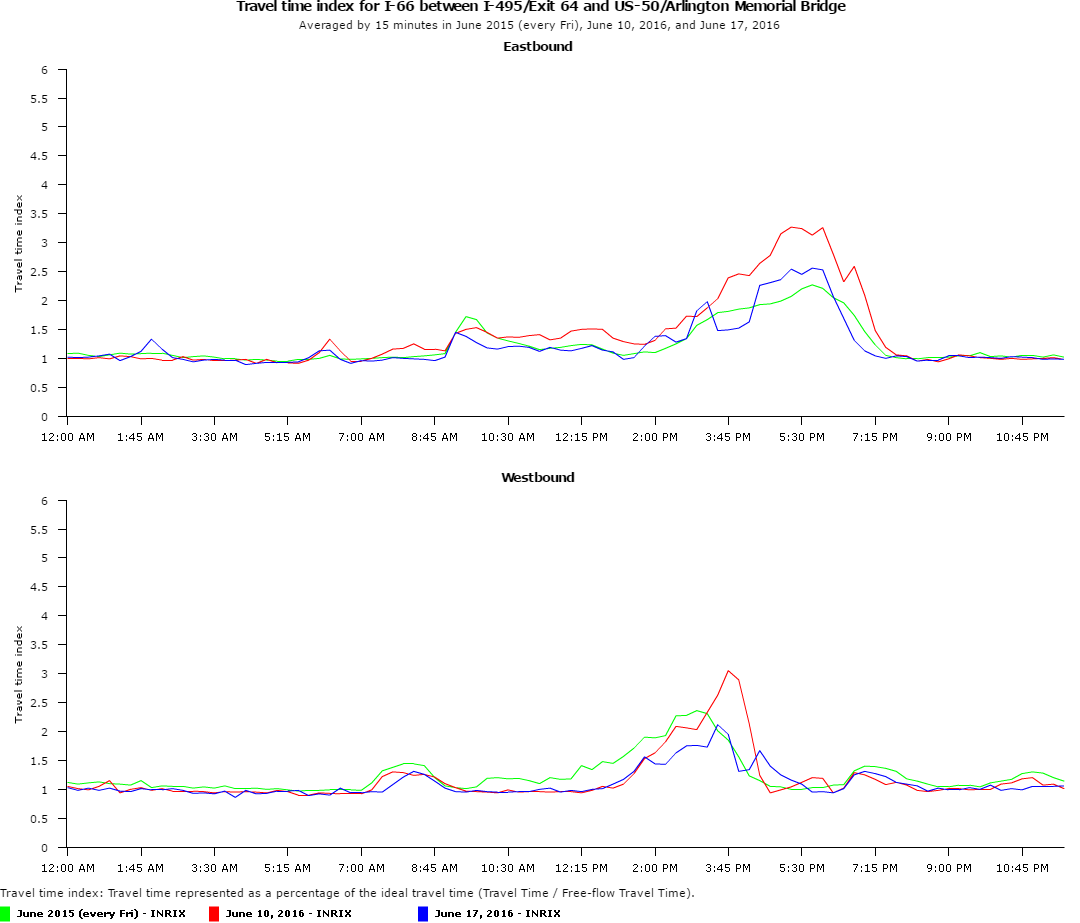
- Travel Time Index Comparison: I-66 between the Capital Beltway and the DC Line; Week 1 (Red) vs Week 2 (Blue) vs Average Week June 2015 (Green)
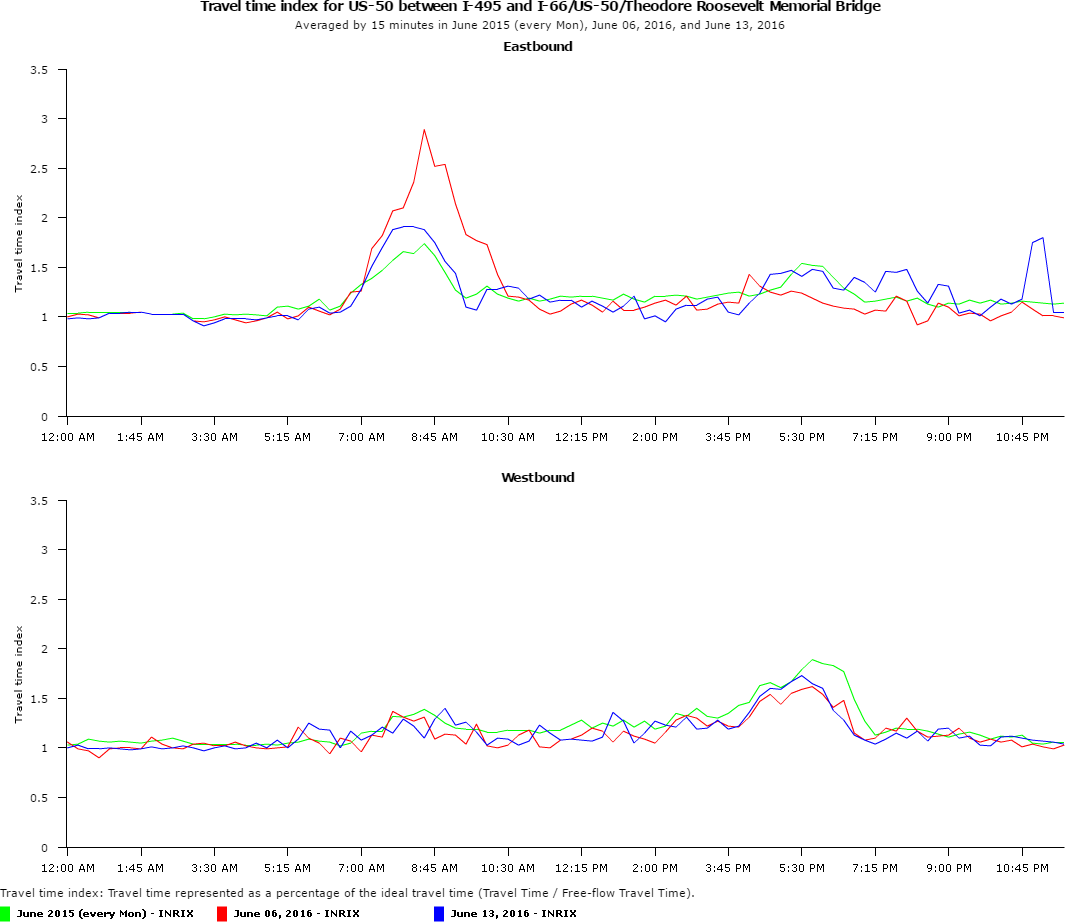
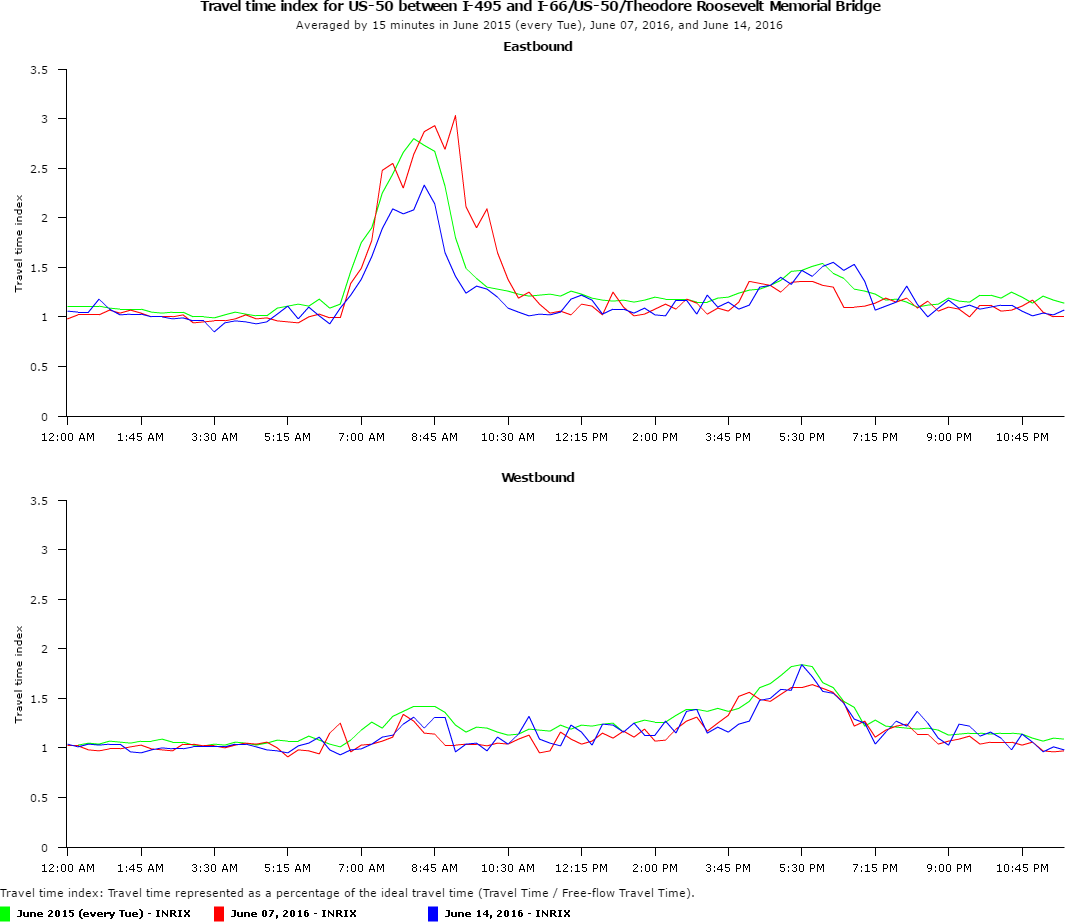
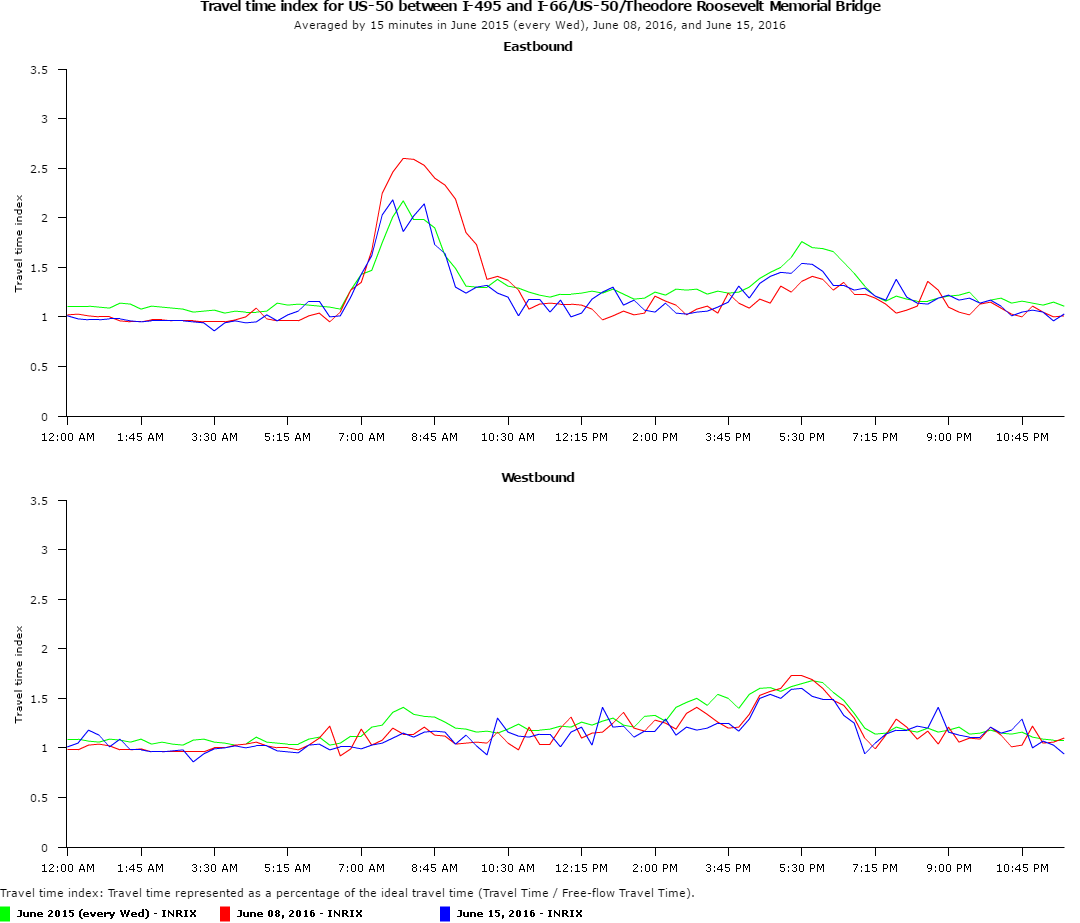
- Travel Time Index Comparison: US-50 between the Capital Beltway and the DC Line; Week 1 (Red) vs Week 2 (Blue) vs Average Week June 2015 (Green)

- Travel Time Index Comparison: I-395 between the Capital Beltway and the DC Line; Week 1 (Red) vs Week 2 (Blue) vs Average Week June 2015 (Green)
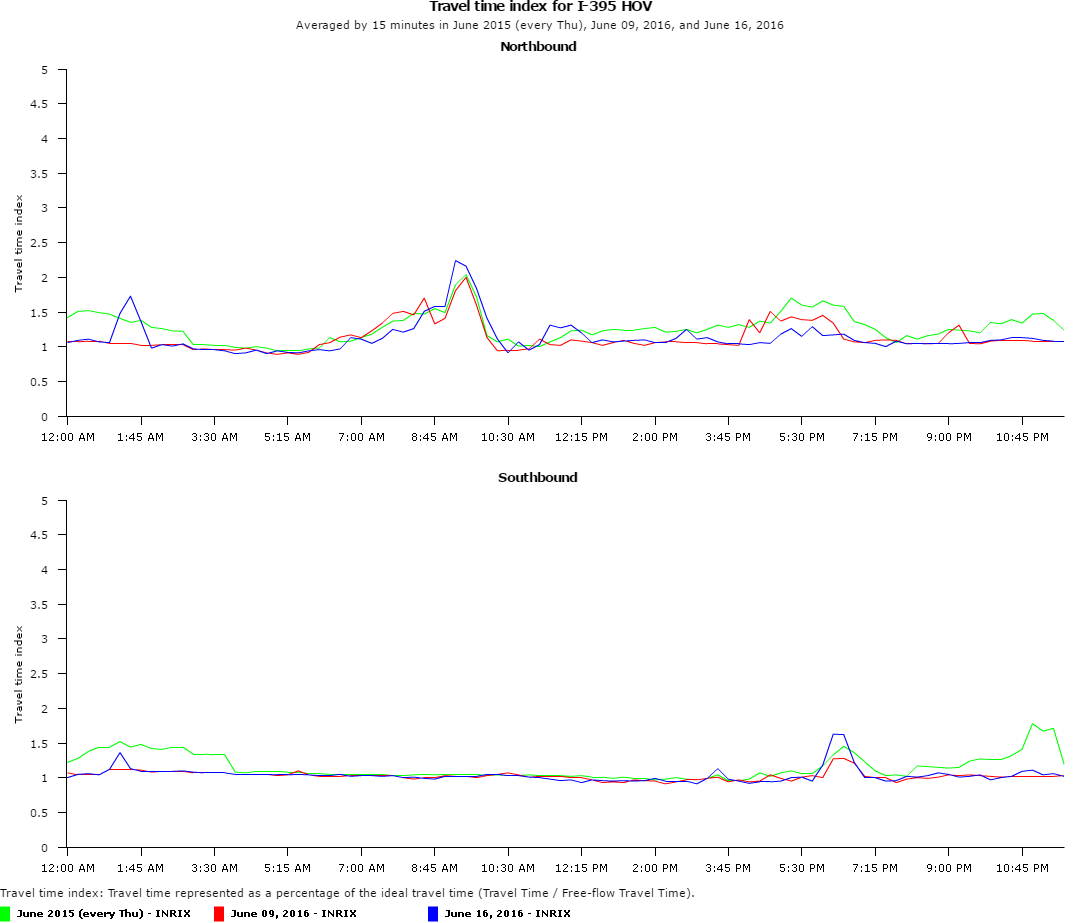
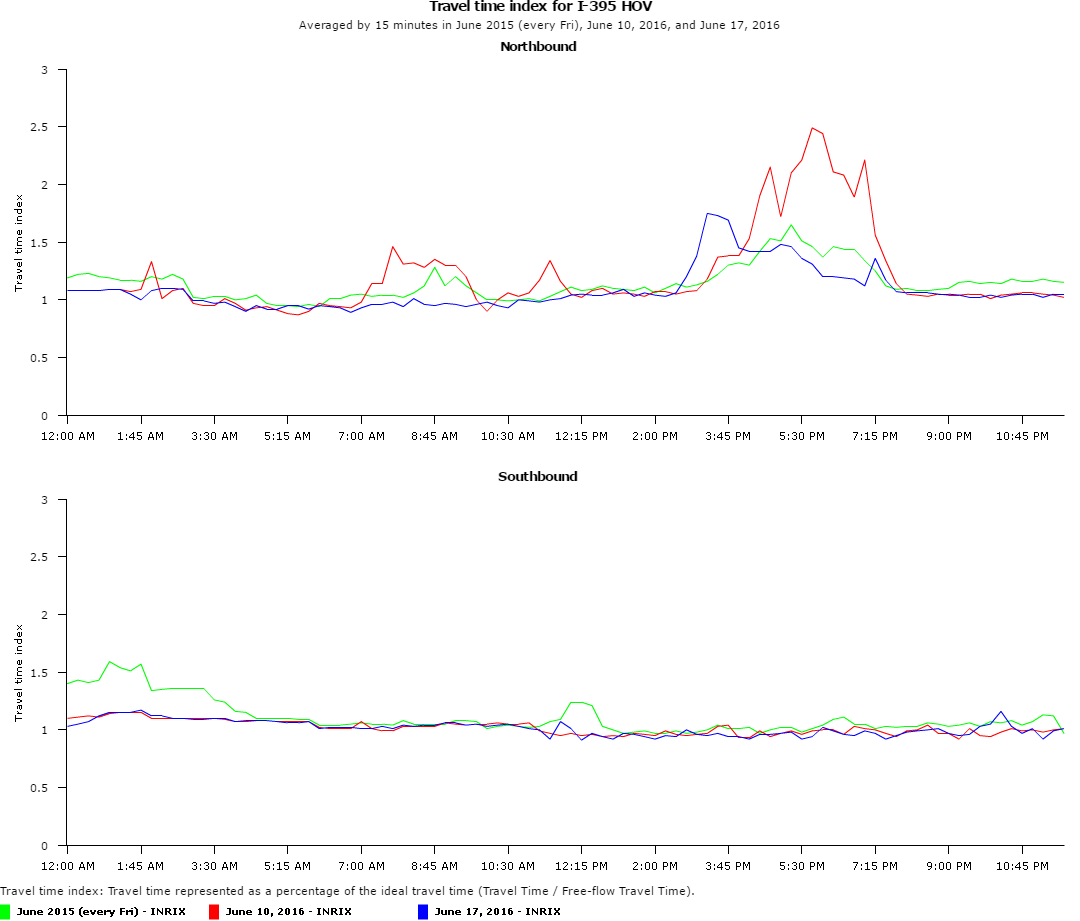
- Travel Time Index Comparison: I-395 HOV between the Capital Beltway and the DC Line; Week 1 (Red) vs Week 2 (Blue) vs Average Week June 2015 (Green)
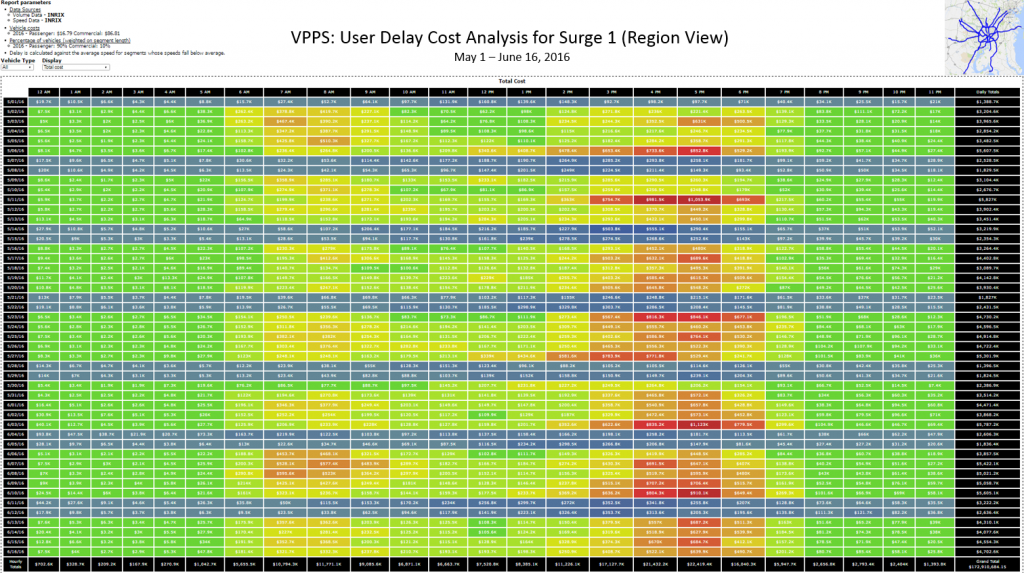
- User Delay Cost Analysis for Safety Surge #1 (Region View)
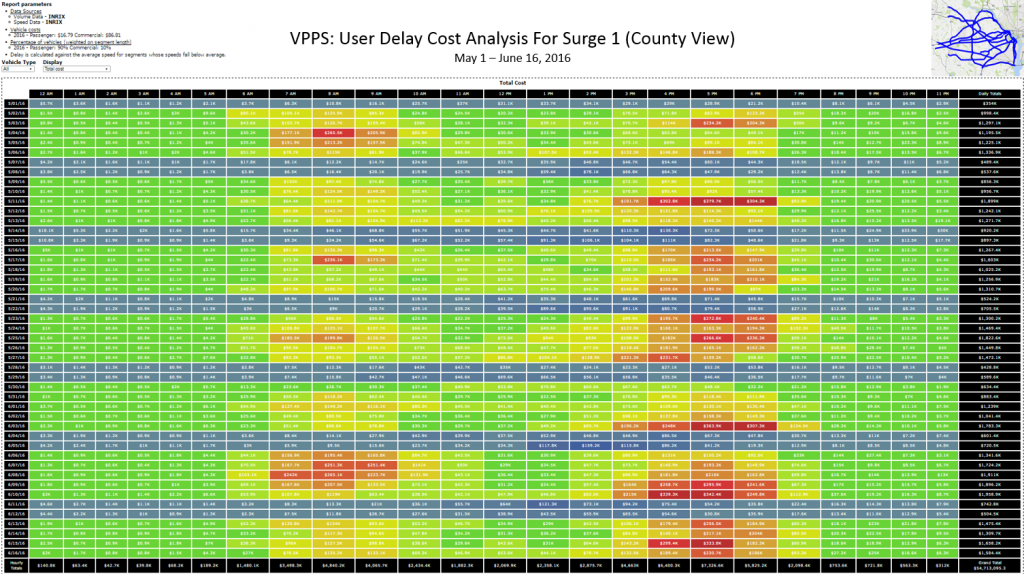
- User Delay Cost Analysis for Safety Surge #1 (County View)
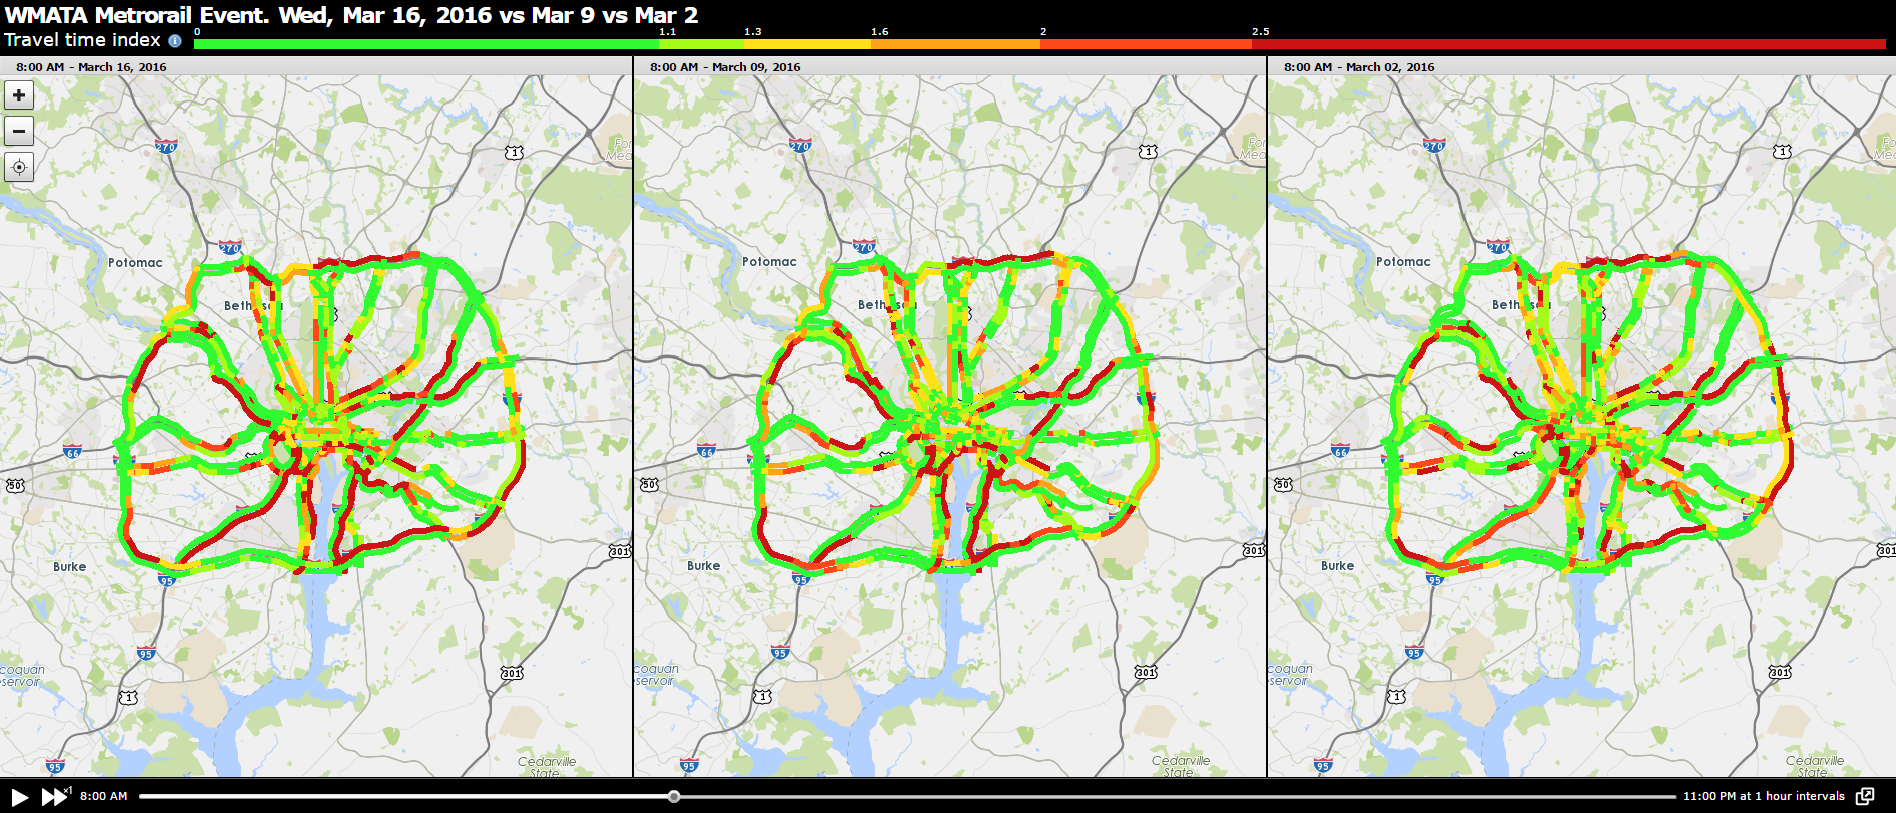
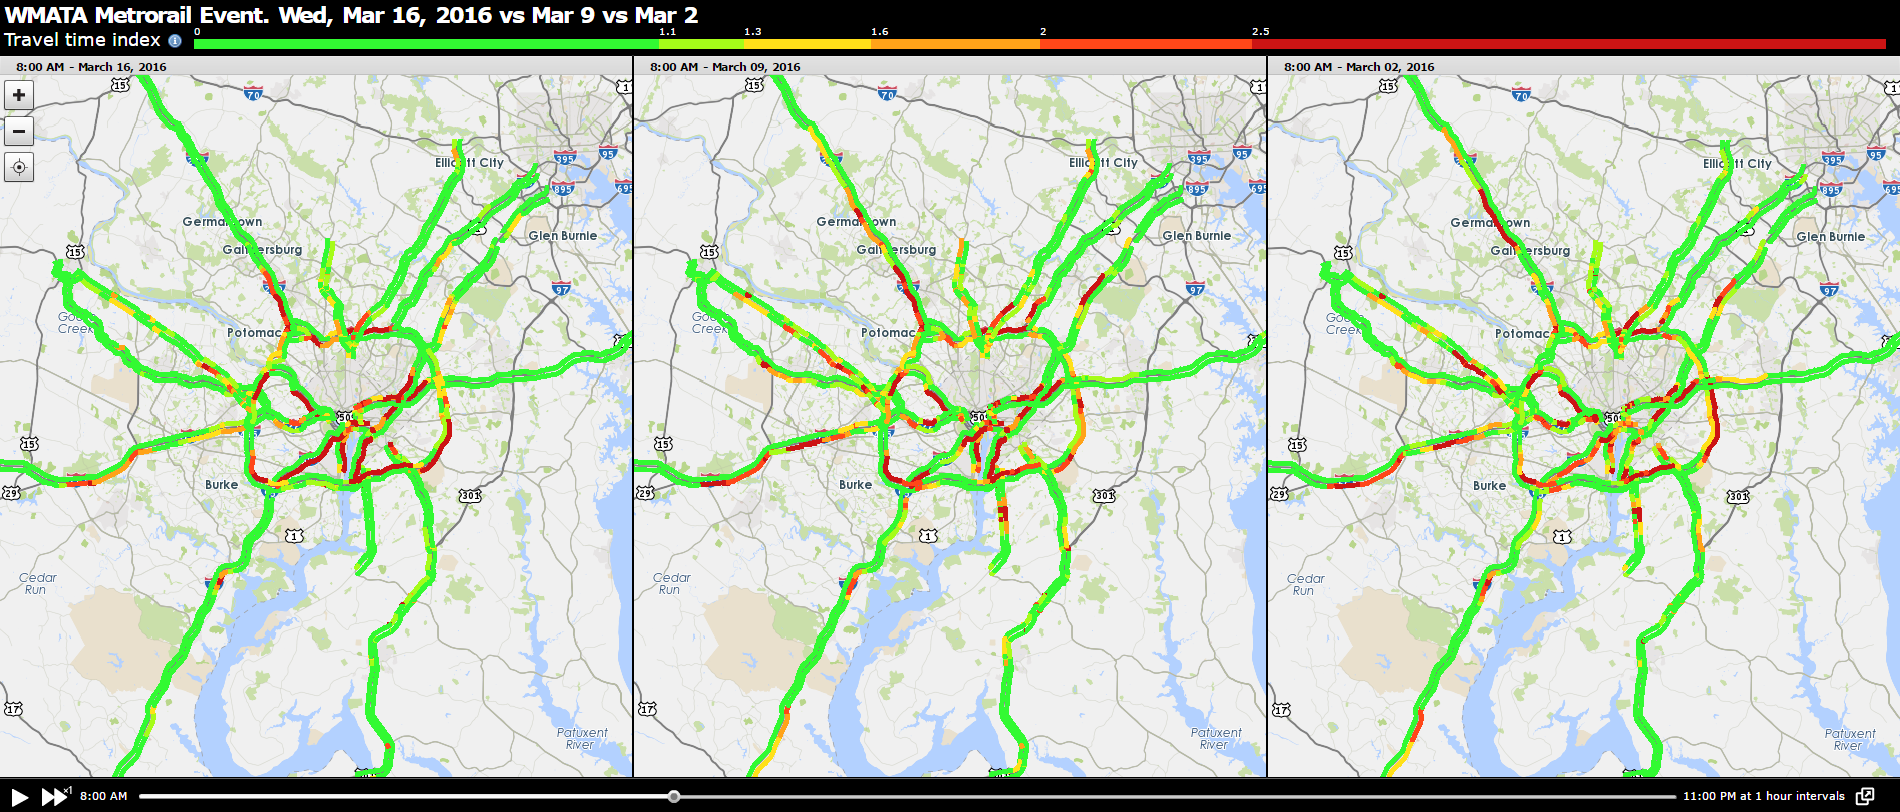
WMATA Metrorail Shutdown – March 16, 2016 Trend Maps
- Travel Time Index. National Capital Region: March 16 vs March 9 vs March 2
- Travel Time Index. Inside the Capital Beltway: March 16 vs March 9 vs March 2